


Table of contents:
JetMetrics App update
Article
Post of the week
Dashboard of the week
JetMetrics App weekly update
Influencing Metrics are now clickable.
You can now dive into any influencing metric straight from the list — no need to scroll or search.
It makes exploring the story behind changes much smoother. One click, and you’re already looking at what might be driving the shift — then the next, and the next, until the whole picture starts to come together.
Check out the product’s roadmap – https://jetmetrics.io/roadmap
JetMetrics is currently in a closed beta. Book a 1:1 demo to connect Shopify store.
How discounting kills your metrics — and how to stop it
Discounts are a normal part of doing business. Especially in e-commerce.
You use them to clear inventory, boost short-term revenue, bring in new customers. And they work — fast.
But they also change how people behave.
And when behavior shifts, so do your metrics.
Conversion rates rise. CAC drops. AOV goes up.
It looks like growth — but much of it is temporary, and some of it can be misleading.
This article shows how discounts affect your key metrics, where the traps usually hide, and how to analyze promo results more consciously — without fooling yourself or your team.
Because discounting isn’t the problem.
Uncritical analysis is.
Metrics under the influence
Discounts don’t affect just revenue. They touch nearly every metric in your dashboard — some more obviously than others.
Some numbers go up and look great (even if they’re misleading). Others quietly get worse — and stay hidden unless you know where to look.
Let’s break them down.
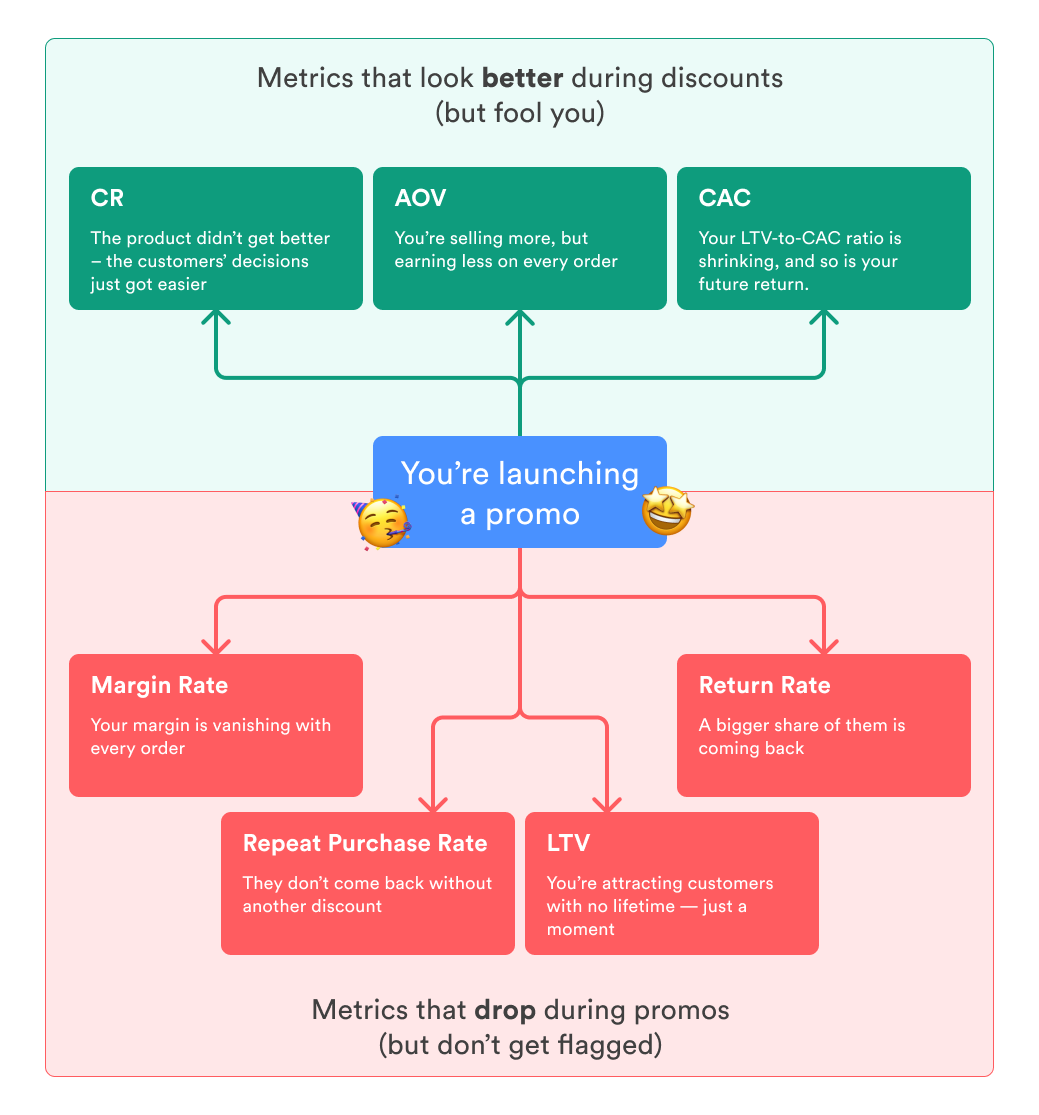
✅ Metrics that look better during discounts
(but fool you)
Some metrics light up green during a promotion. It feels like growth. But these improvements are surface-level — and often misleading.
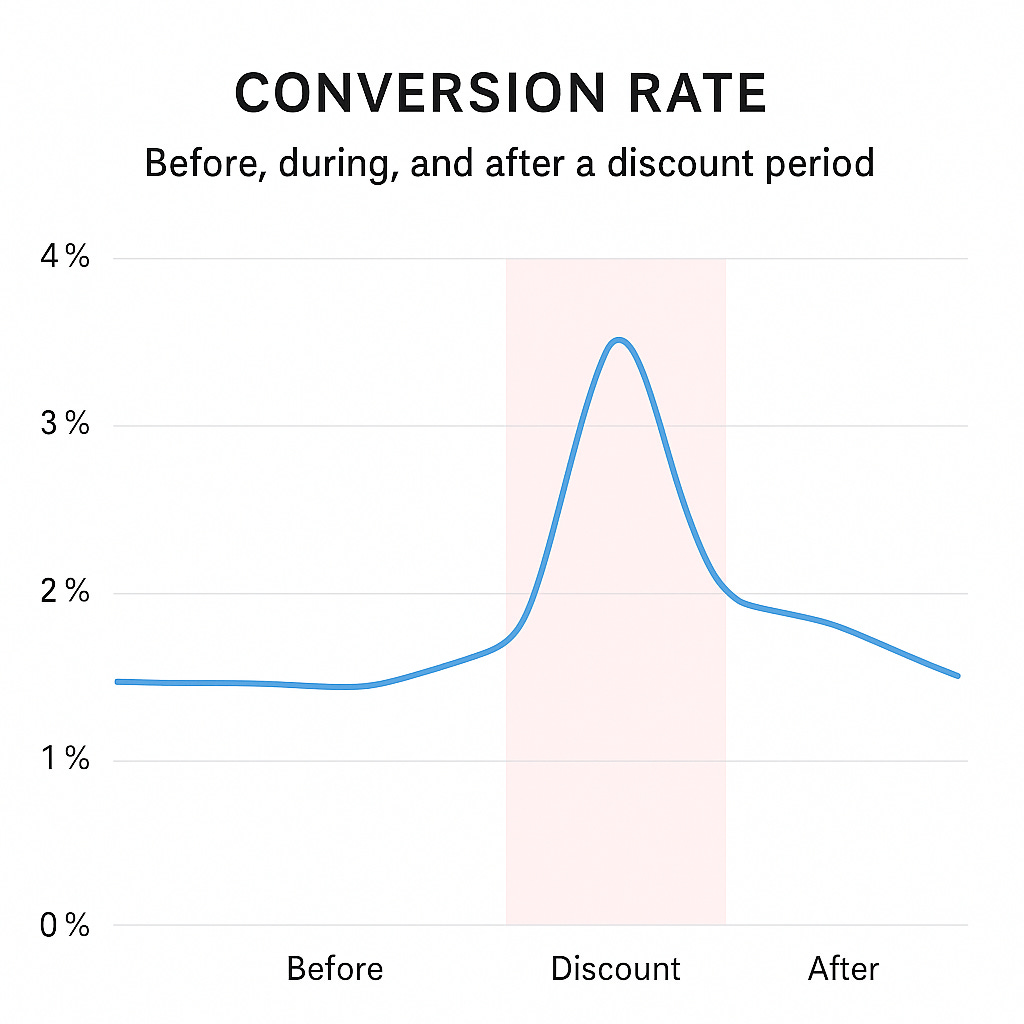
1. Conversion Rate (CR)
Lower prices lead to more purchases — so CR goes up. But it doesn’t mean your funnel got stronger. The decision just became easier.
Once the discount ends, the rate usually drops again — and comparisons get messy.
🤩 Looks good: CR goes up
😑 Hides this: The product didn’t get better — the decision just got easier.
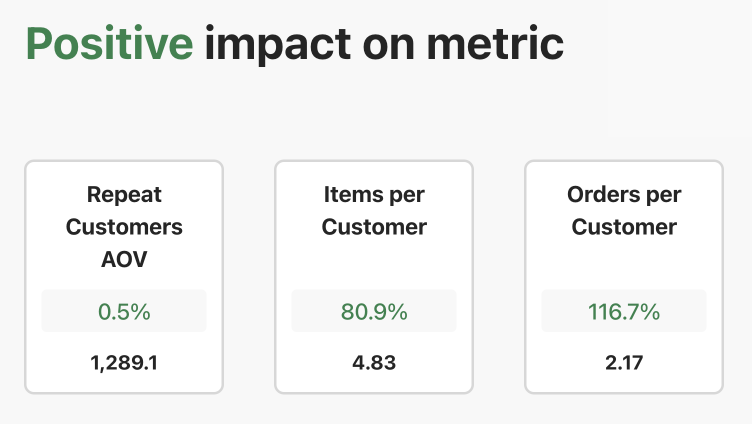
2. Average Order Value (AOV)
Discounts can boost AOV — especially with tiered offers. People add more to reach a threshold, and average order size goes up.
But often, you’re earning less per item. And when the promo ends, AOV “falls,” even if behavior hasn’t changed.
🤩 Looks good: AOV rises during the promo
😑 Hides this: You’re selling more — but earning less on every order.
3. Customer Acquisition Cost (CAC)
Promos drive more conversions from the same spend — so CAC drops.
It looks like your ads are working better.
But if these customers don’t stick, lower CAC just means cheaper churn. That’s when your LTV-to-CAC ratio starts to break down.
🤩 Looks good: CAC improves during discounts
😑 Hides this: Your LTV-to-CAC ratio is shrinking — and so is your future return.
🔻 Metrics that drop during promos (but don’t get flagged)
These metrics don’t look better during a discount campaign — in fact, they quietly start to decline. The damage isn’t always visible at first, but it shows up in retention, profitability, and long-term health.
4. Gross Margin / Margin Rate
More orders don’t mean more profit. Heavy discounts can wipe out your margin — especially on low-margin products.
And because many teams don’t track margin directly, this damage often goes unnoticed.
🤩 Looks good: Revenue grows during the sale
😑 Hides this: Your margin is vanishing with every order.
5. Repeat Purchase Rate / Retention
Discounts bring in first-time buyers — but rarely build loyalty. Many won’t return unless there’s another deal.
This metric shows the drop in returning customers that often follows promo periods.
🤩 Looks good: More people complete a first order
😑 Hides this: They don’t come back without another discount.
6. Customer Lifetime Value (LTV)
LTV depends on retention — but it reflects something bigger: how much value each customer brings over time. When discounts bring in short-term shoppers, lifetime value starts to fall, even if initial revenue looks solid.
🤩 Looks good: First-purchase revenue seems healthy
😑 Hides this: You’re attracting customers with no lifetime — just a moment.
7. Return Rate
Promotions can drive faster, more impulsive purchases. And with less time spent thinking, more people end up returning what they bought.
This is especially common in fashion, beauty, and anything where sizing or preference matters.
If your return rate goes up after a sale, your net revenue suffers — but it might take weeks before you notice the pattern.
🤩 Looks good: More orders come through
😑 Hides this: A bigger share of them is coming back.
How to keep your analysis honest during promos
So what if your metrics get messy during a discount?
Conversion goes up. AOV climbs. CAC drops. That’s good, right?
But the story promo metrics tell is temporary, distorted, and sometimes dangerous. If you don’t adjust your lens, you’ll end up celebrating noise, chasing fake drops, and making decisions on warped data.
Here’s how that happens — and how to stop it.
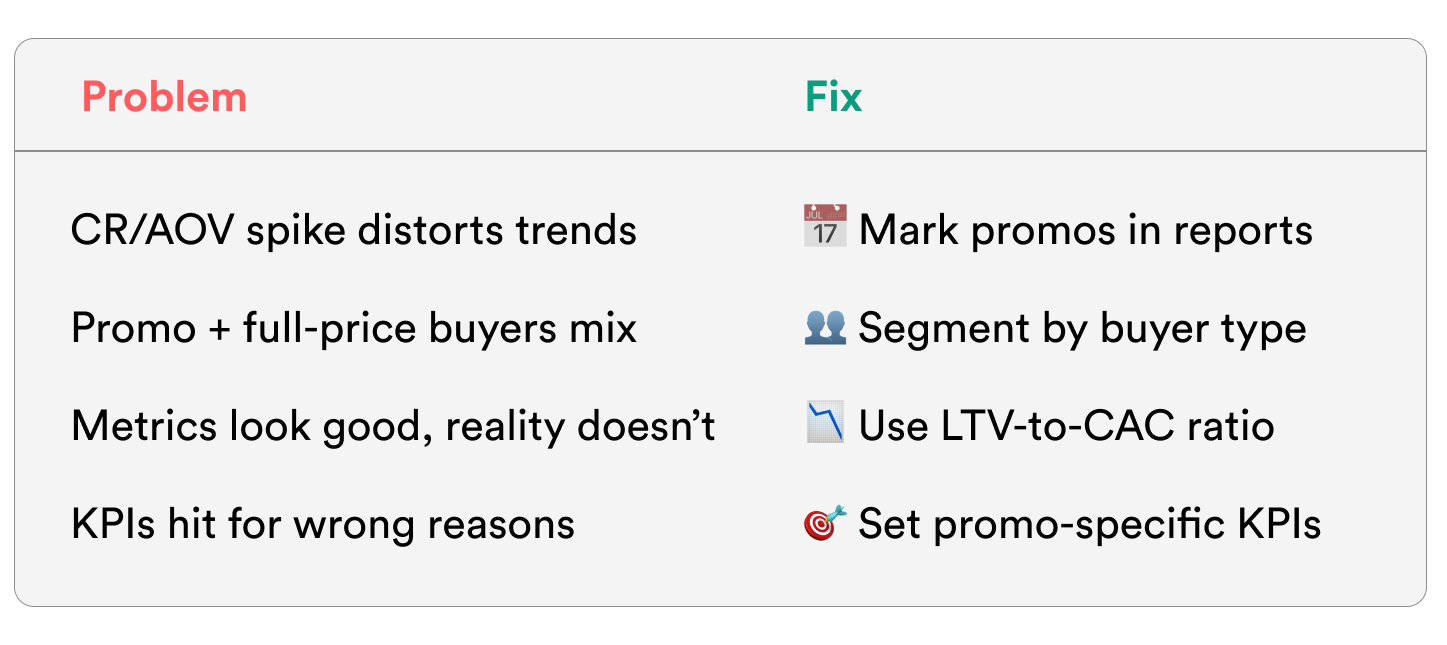
Period comparisons stop making sense
Promos inflate metrics like CR and AOV, which makes post-promo results look worse than they really are. You end up chasing dips that aren’t dips — just a return to normal.
Mark promo periods in your dashboards. Treat them as their own category — and compare only against other promotions. This keeps trends real and reactions reasonable.
Customer segments blend together
Full-price and discount-driven customers behave differently. But if you don’t analyze them separately, your retention and LTV metrics become fuzzy and unreliable.
Segment buyers by acquisition type. Track promo-only customers separately from organic ones. You’ll get clearer insight into loyalty, value, and where to focus next.
Analytics loses credibility
If your reports look great but reality doesn't match, trust fades. Teams stop acting on insights — and start relying on gut feel again.
Use the LTV-to-CAC ratio as your compass. It cuts through the noise of vanity metrics and forces you to focus on real outcomes: sustainable growth, not just short-term gains.
People hit their KPIs for the wrong reasons
Conversion rates go up, CAC goes down, and AOV looks great. Everyone celebrates. But what really changed? Often, it was just a promo. Bonus goals are met, yet no long-term improvement has happened.
Adjust KPIs for promo periods. Create separate benchmarks and attribution models for sales weeks. This lets you reward real impact — not just promo-driven spikes.
Final thoughts
We’re not saying don’t run discounts.
There are valid reasons to do it — clearing inventory, hitting revenue targets, or moving new customers into your funnel.
If this article helped you spot where things get fuzzy, great.
Now you know what to watch, what to question, and how to make smarter decisions next time your dashboard turns green during a sale.
The goal isn’t to stop discounting. It’s to analyze it consciously.
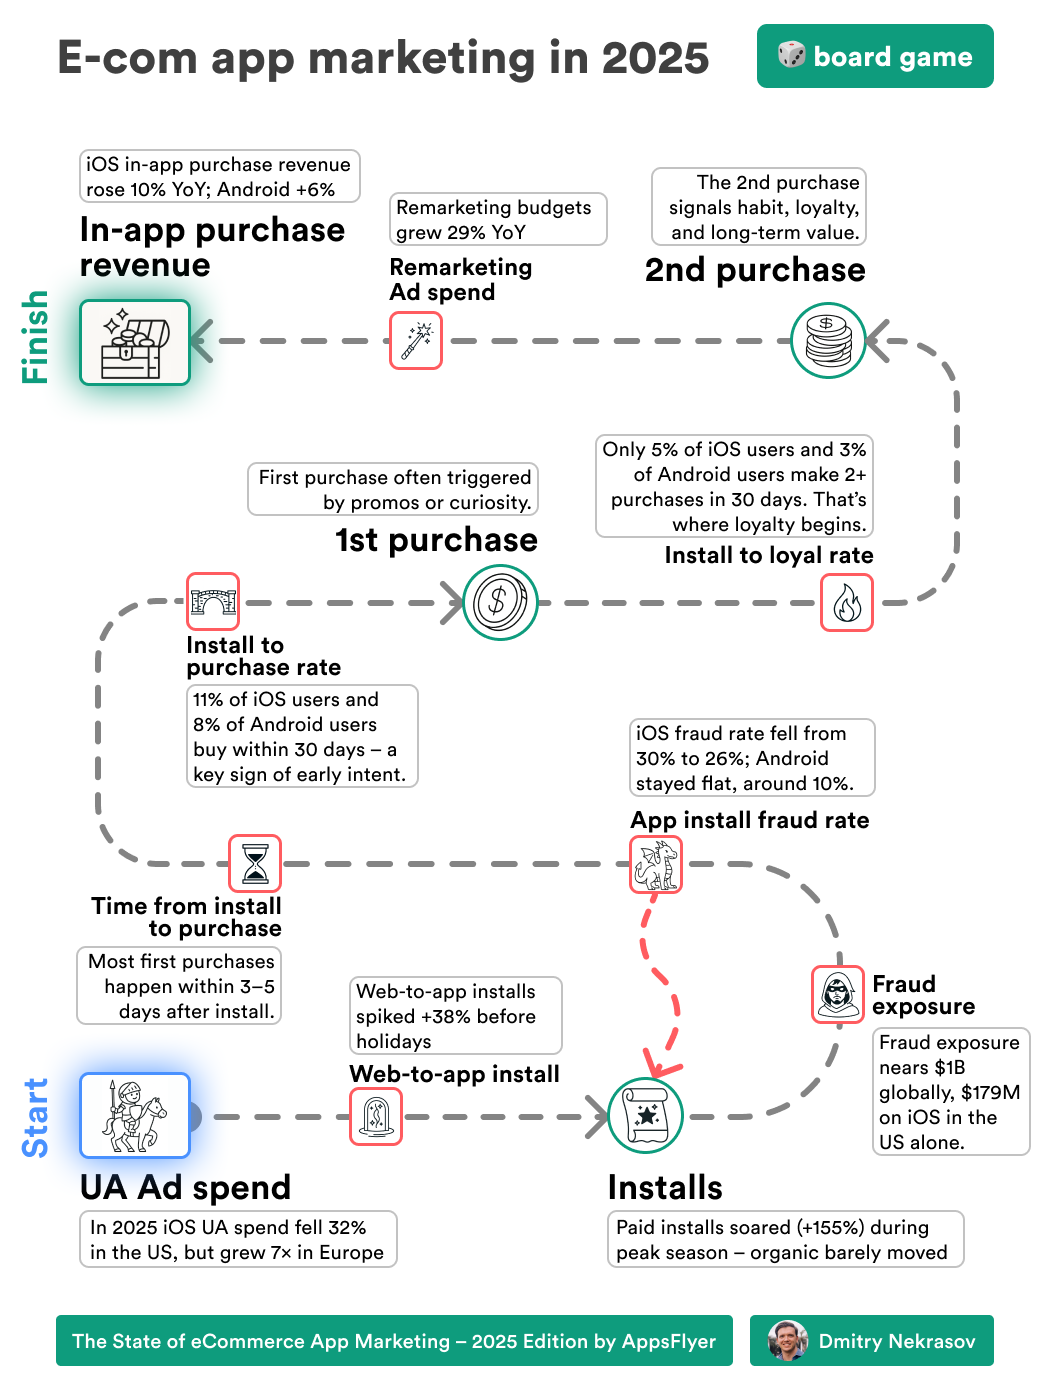
LinkedIn post of the week
Dashboard of the week
It’s live: Updated CRO Funnel Dashboard
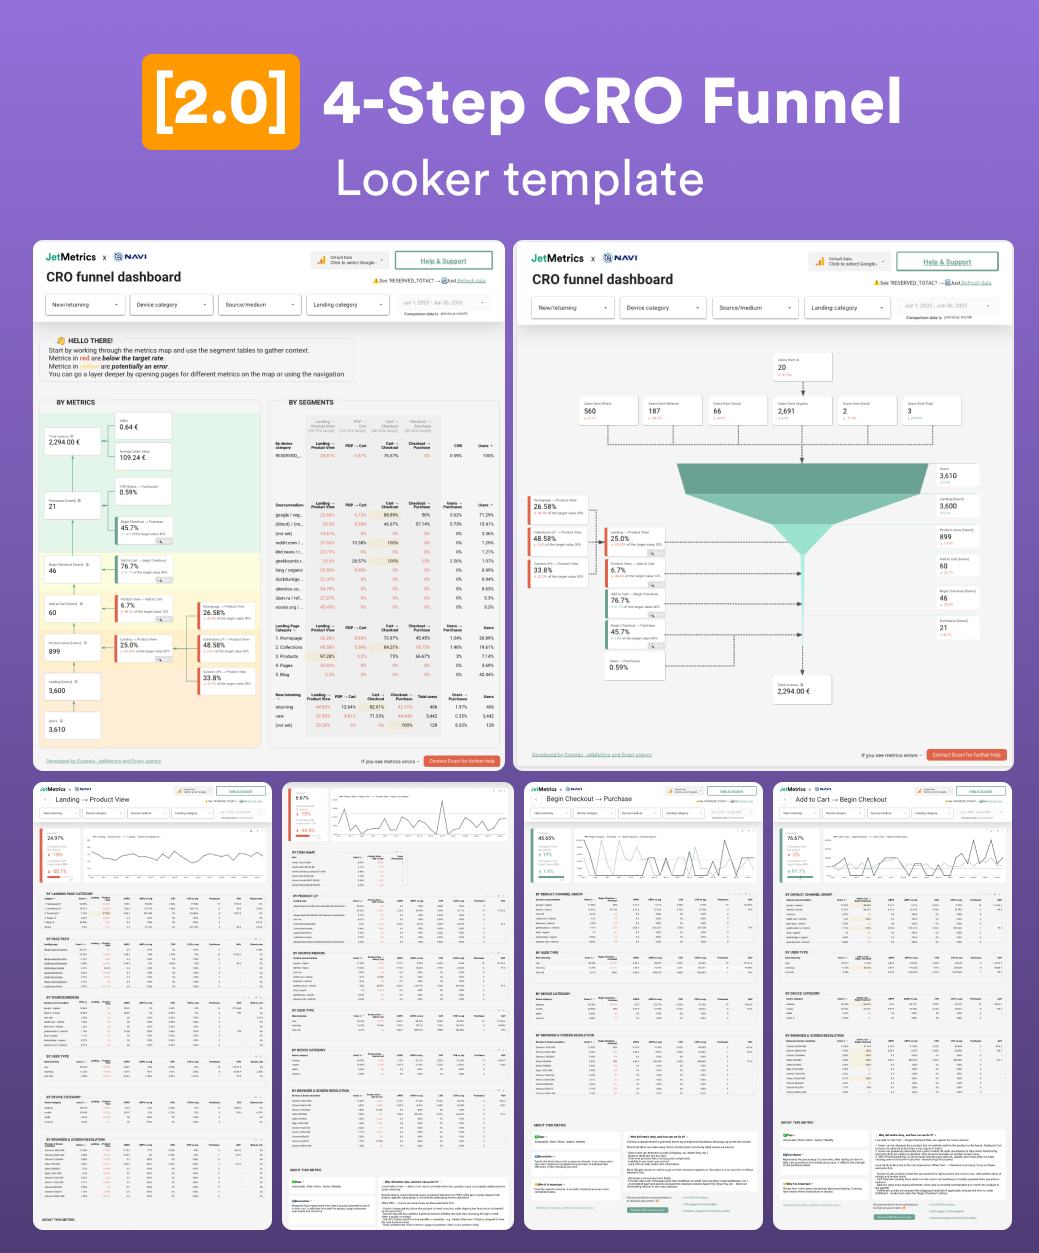
The update is here – with new filters, cleaner segment breakdowns, and an optional funnel view for the classics fans.
You can try the new version for free (no copying needed).
Or grab the full version if you want your own.
Happy analyzing 🫶
See you next week!
Dmitry from JetMetrics