


Table of contents:
JetMetrics App update
Article
Guide of the week
Post of the week
JetMetrics App weekly update
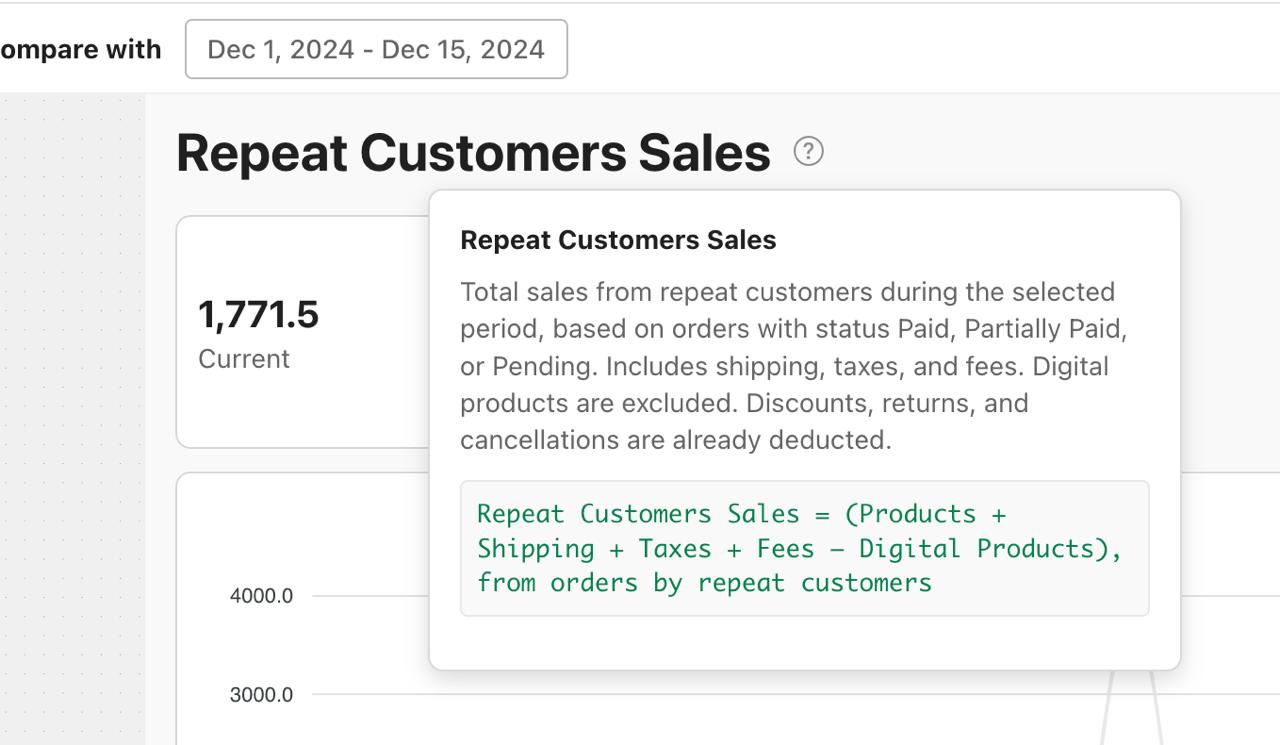
We added a definition, a calculation method description, and a formula for each metric inside the interface.
By adding this, JetMetrics helps users:
Trust the data
Explain metrics to clients and teammates
Debug inconsistencies across tools
Learn what each number tells you (and what it doesn’t)
Check out our public roadmap – https://jetmetrics.io/roadmap
JetMetrics is in a closed beta now. Book a 1:1 demo to connect Shopify store.
How to Identify and Fix Underperforming Products Using Metrics
Why ABC Analysis Isn’t Enough
When it comes to product analytics, most teams start with ABC analysis. It’s simple: sort products by revenue or margin into A, B, and C categories. But the problem is – this approach only looks at the outcome, not the cause. It’s like judging a player by the scoreboard without knowing how they played.
ABC analysis tells you which products made money, but says nothing about why some sell and others don’t. It doesn’t catch weak listings with strong potential. It doesn’t show which products fail to convert or get returned too often. So businesses end up killing products that could’ve been fixed, just because no one dug deeper.
But in many cases, the problem isn’t final – it’s fixable. Sometimes it’s the product page. Sometimes the price. Sometimes just a positioning tweak. The key is knowing what’s actually broken. And that’s what we’re about to explore.
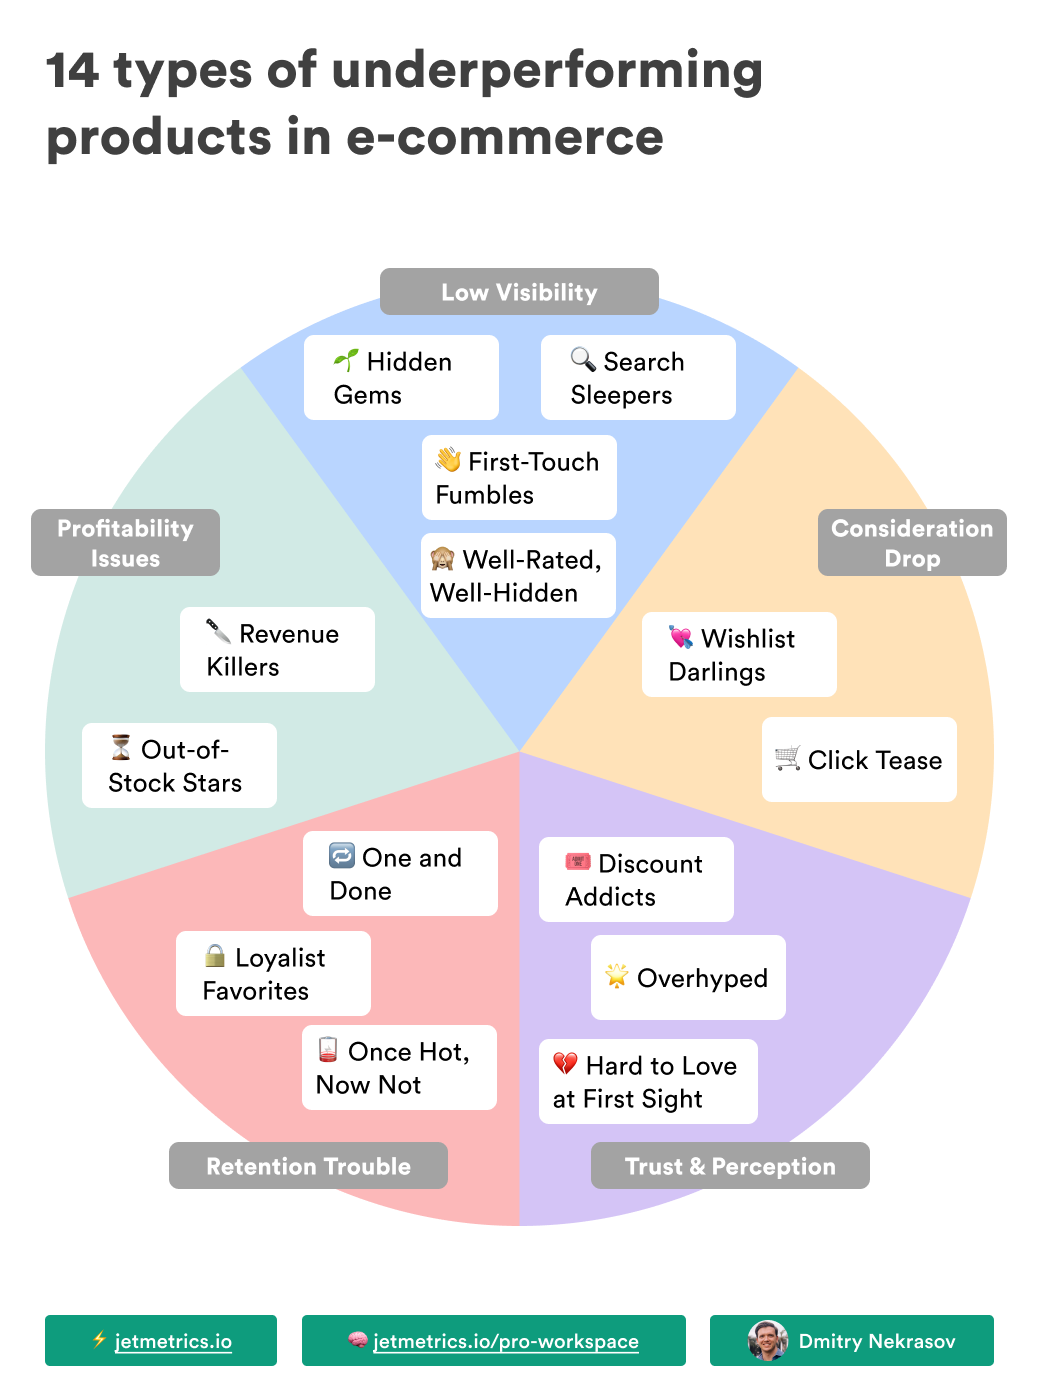
I. Seen but not bought products
1. The Click Tease
People are curious but don’t convert – something turns them off.
These products attract attention but fail to convert – you're losing warm traffic that’s already interested. There's clear intent, but something is blocking the sale.
How to identify?
High
product viewsortime on pageLow
add-to-cart rateorconversion rateHigh engagement (
image clicks,scrolls) without purchase
💡 Look for products with Product Page Views to Add-to-Cart Rate < 2% – especially if Time on Page or scroll depth is above average.
How to fix?
Add trust elements like reviews, guarantees, or badges – especially near price or CTA.
Test different pricing tiers if the current price feels too high for its perceived value.
Restructure the page to surface key info (benefits, materials, delivery) earlier.
2. Wishlist Darlings
Loved and saved – but rarely bought.
People love these products, but don’t buy them. That gap often points to fixable friction, like price or timing.
How to identify?
High
view-to-cart rateLow
cart-to-checkout rateHigh number of
wishlist savesorfavorites
💡 Spot products with Wishlist Saves to Product Views > 10%, but Checkout Rate < 1% — clear gap between interest and purchase.
How to fix?
Target with retargeting campaigns, back-in-stock alerts, or wishlist reminders.
Add urgency through limited-time offers or low-stock messaging.
Reassure with better info around delivery, returns, or product benefits.
3. Hidden Gems
Convert well, but barely get seen.
These convert well, but hardly anyone sees them. You’re missing out on easy wins that could grow revenue with more exposure.
How to identify?
High
conversion rateoradd-to-cart rateVery low
product viewsorimpressions
💡 Sort by Add-to-Cart Rate > 5% or Conversion Rate > 3%, but with low visibility in collections or internal links.
How to fix?
Feature in high-visibility areas like homepage, carousels, or “You may also like” sections.
Mention in email flows as “underrated picks” or “hidden customer favorites”.
Run small-budget ads to confirm if scaling exposure increases sales.
4. Well-Rated, Well-Hidden
Loved by buyers, unknown to others.
People who buy them love them – but too few ever do. These are trust-backed winners stuck in obscurity.
How to identify?
High
average ratingVery
low product viewsandorder count
How to fix?
Highlight in “Top Rated” or “Most Loved” collections.
Leverage strong reviews in ads, emails, or banners.
Surface more prominently in filters, recommendations, or search results.
5. Search-Driven Sleepers
Found via search – but still not selling.
These attract the right visitors and convert well, but don't get enough traffic. There's strong product–market fit, just not enough exposure.
How to identify?
High
organic traffic shareGood
add-to-cartorconversion rateLow
total number of viewsorimpressions
How to fix?
Expand content around them: blog mentions, category anchors, or SEO tweaks.
Use strong reviews and CR as proof in paid ad tests.
Promote through newsletters or targeted cross-selling.
6. First-Touch Fumbles
Often seen first – and often the last.
These are often the first products new visitors see, and they underperform. You’re wasting key first impressions.
How to identify?
High
share of viewsfrom new visitorsOften appears in first sessions
Low
conversion rateamong new users
How to fix?
Improve visual first impression – better hero image, headline, and social proof.
Strengthen offer clarity (price, delivery, return policy) to reduce hesitation.
Move out of key landing spots if consistently underperforming.
II. Sold, but not profitable
7. Once Hot, Now Not
Used to sell great – now they don’t.
These were strong performers, but suddenly dropped off. They quietly pull down revenue unless you catch the trend early.
How to identify?
Stable or high
product viewsRecent drop in
conversion rateornumber of ordersvs. previous periods
How to fix?
Review recent changes (price, stock, reviews, ad creative) that could have impacted CR.
Refresh the visuals and copy to make the product feel new or seasonal.
Pause it temporarily, then reintroduce with a different angle, bundle, or campaign.
8. Revenue Killers
Big revenue, terrible margins.
These bring in a lot of sales but little profit. They make your revenue look healthy while quietly draining margin.
How to identify?
High
share of total revenueLow
product marginor highcost of goods sold
How to fix?
Raise the price or reduce COGS to restore profitability.
Limit ad spend or traffic sources that drive unprofitable volume.
Pair with high-margin add-ons or use as lead-ins in bundles.
9. Overhyped
Great reviews, but high returns or no repurchases.
These look great on the surface, but disappoint after purchase, leading to returns or churn. That mismatch kills trust and margins.
How to identify?
High
ratingsand manyreviewsLow
repeat purchase rateorhigh return rate
💡 Look for products with Return Rate > 20% or Repeat Purchase Rate < 3%, despite high review count or 4.5+ star average.
How to fix?
Make product pages more honest – update photos, descriptions, and sizing guides to match reality.
Address most common return reasons directly on the page.
If margins are poor, reduce exposure or exclude from paid ads and bundles.
10. The Always Out-of-Stock Stars
Sell fast – when they’re not sold out.
These could be bestsellers, but they’re often unavailable. You lose sales every time they’re out of stock.
How to identify?
Frequent out-of-stock status
High
sales velocitywhen in stockSharp spikes in sales after restocking
How to fix?
Improve inventory planning or restock frequency for these SKUs.
Offer pre-orders or waitlist signups to capture demand.
Show urgency cues (“back soon”, “hot seller”) when in stock.
11. Discount Addicts
Only move when there’s a coupon.
These only sell with discounts. They train customers to wait for deals and erode profitability.
How to identify?
High
share of salesmade with discounts or couponsVery low
conversion rateat full price
💡 Flag items where >70% of orders used a discount code or CR without promo < 1% – these heavily depend on price incentives.
How to fix?
Test price sensitivity – small increases may preserve sales without promo.
Improve product perception through better imagery and value framing.
If deeply unprofitable, treat as a deliberate loss leader or reduce exposure.
III. Bought once, but not again
12. One and Done
Customers buy once, never return.
These items bring in customers who never return. They don’t help build LTV or long-term growth.
How to identify?
High
share of first-time customersLow
repeat purchase ratefor the same product
💡 Filter for SKUs with Repeat Purchase Rate < 5%, even after 60–90 days – strong sign of one-time usage.
How to fix?
Offer logical follow-up products or add-ons in post-purchase flows.
Position it as a gateway into a broader category or need, not a one-off solution.
Bundle with complementary products to drive repeat engagement.
13. Loyalist Favorites
Regulars love them – newcomers don’t see them.
Your repeat customers buy these often, but new ones don’t. You’re missing a chance to hook new visitors with proven winners.
How to identify?
High
share of ordersfrom repeat customersVery low
engagementorsalesamong new users
How to fix?
Promote to new users with tags like “bestseller among repeat customers”.
Include in onboarding flows and first-time buyer collections.
Surface in search or recommendations when browsing similar items.
14. Hard to Love at First Sight
Amazing repeat rate – if they buy once.
Loyal buyers love them, but first-time shoppers hesitate. A few small tweaks could unlock their real power.
How to identify?
High
repeat purchase rateafter first orderLow initial
conversion rateOften added to cart but purchased later or only after exposure via bundles
💡 Check products where Repeat Purchase Rate > 30%, but First-Time Purchase Conversion Rate < 1% – classic late bloomer pattern.
How to fix?
Add explainer content (e.g. how it works, real-life use cases).
Offer trial sizes, starter bundles, or guided product discovery.
Pre-select variants or simplify options to reduce decision fatigue.
Final Thoughts
Product analysis isn’t just about “keeping what sells.”
It’s how you turn your catalog into a performance engine, driving more profit from what you already have.
Start with just a few patterns from this guide, and you’ll likely find products worth fixing before you spend more on traffic.
Guide of the week
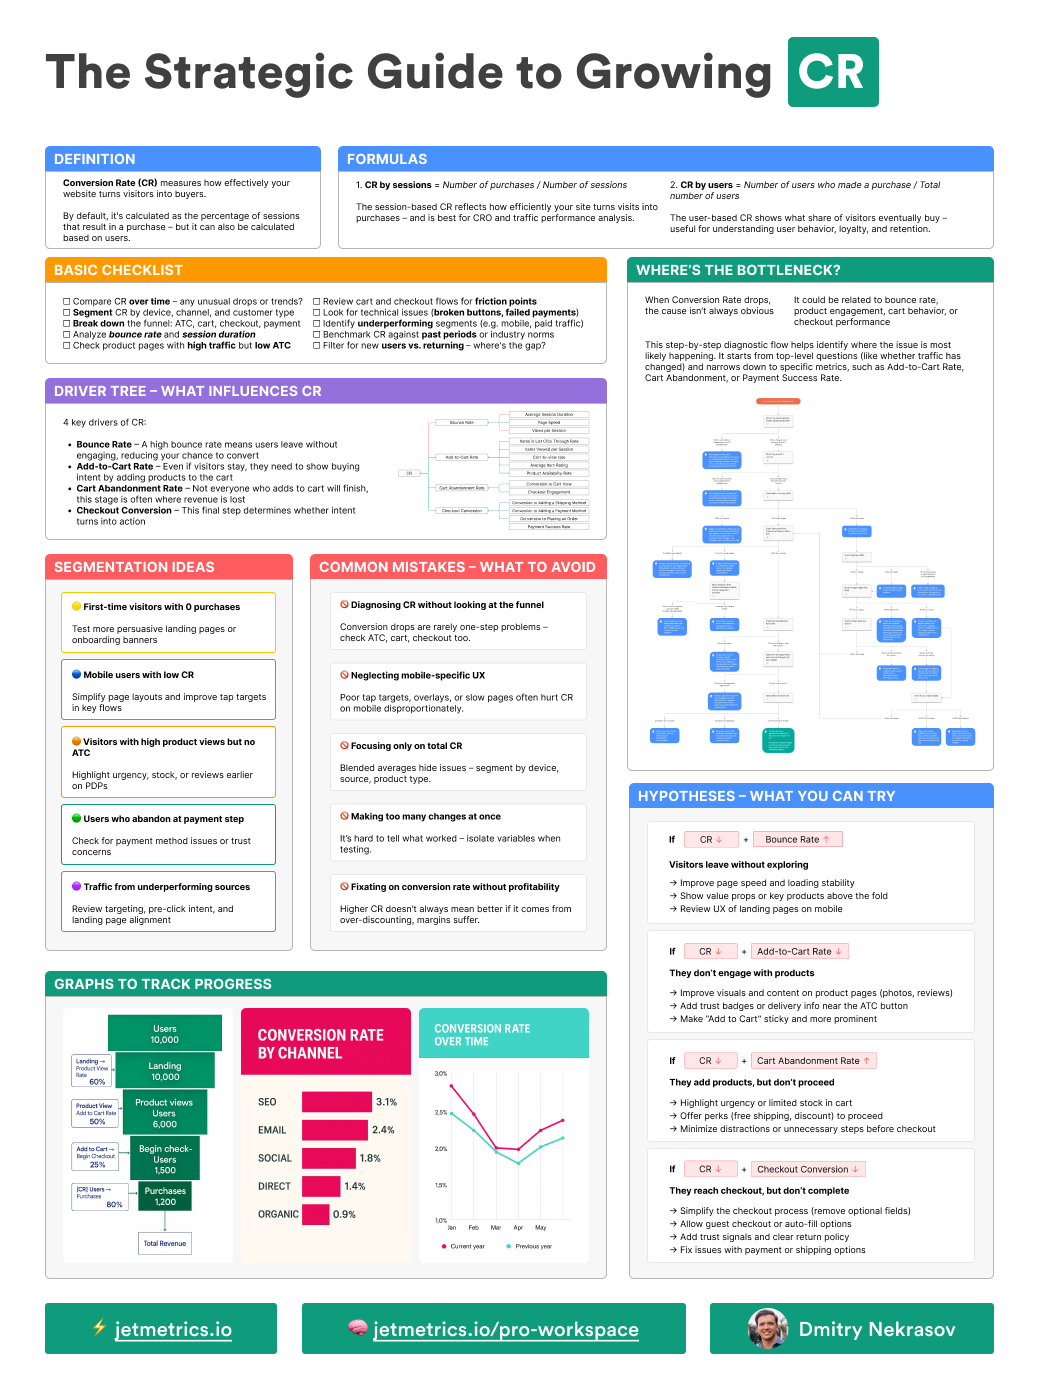
This guide is a part of our next big thing — JetMetrics Workspace
Here’s what’s inside the guide:
Basic checklist – what to review
Driver tree – 18 metrics that influence CR
Algorithm for how to find bottlenecks
5 segmentation ideas to slice your users based on CR
5 common mistakes in managing the metric
4 hypotheses of decreasing causes
Graph examples for dashboards
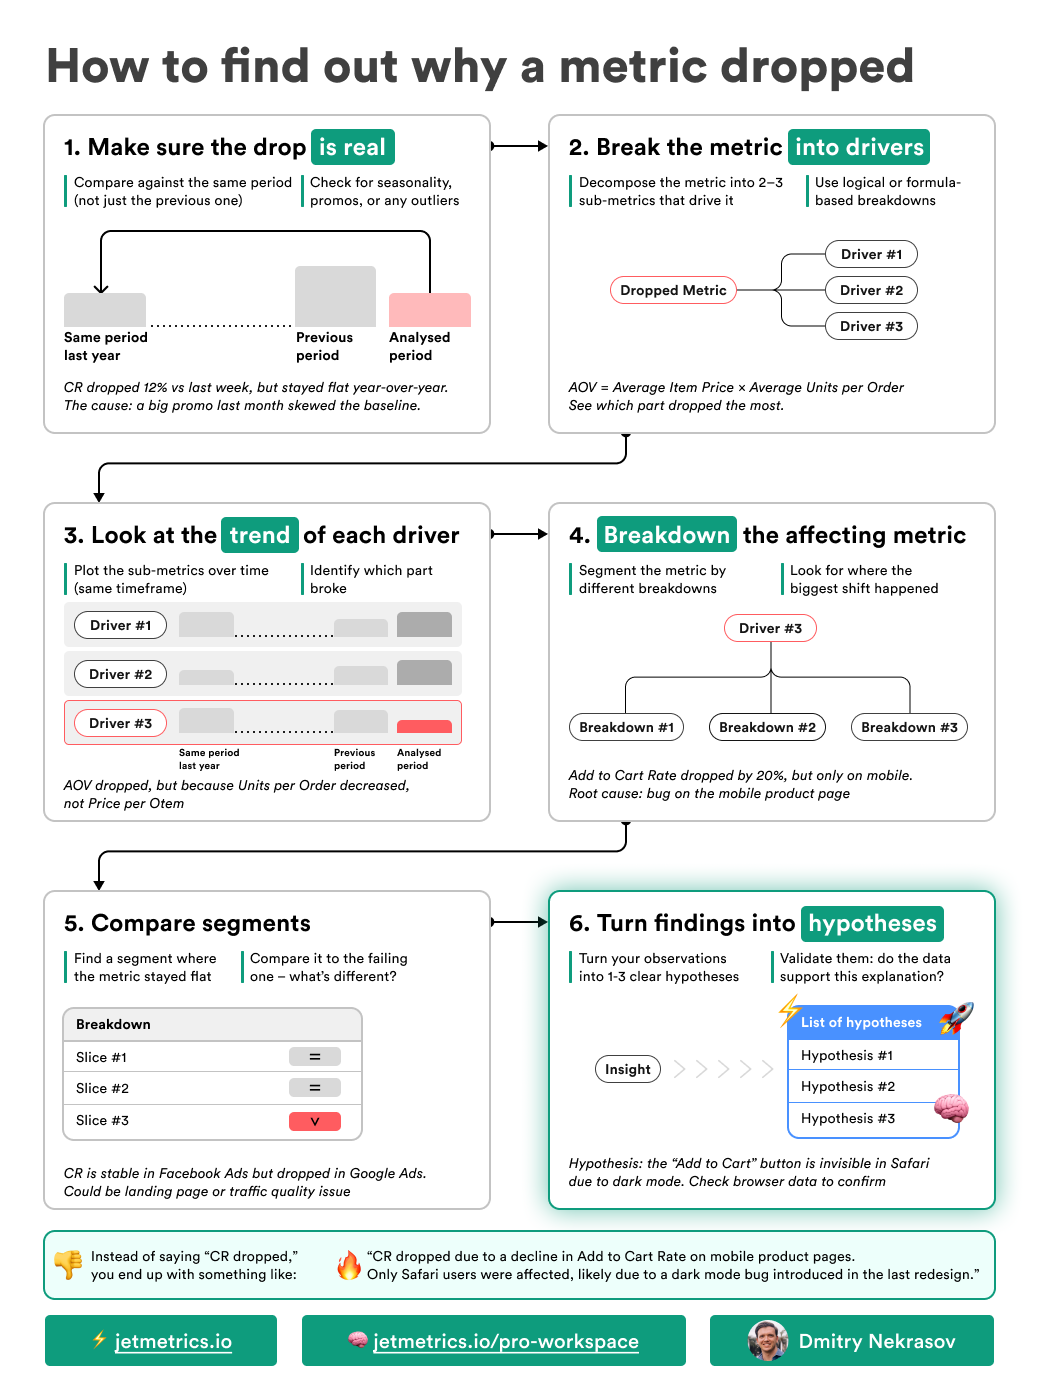
LinkedIn post of the week
Happy analyzing 🫶
See you next week!
Dmitry from JetMetrics