


Table of contents:
JetMetrics App update
Article
Post of the week
Update of the week
JetMetrics App weekly update
🌀 Metric migration is underway
We’ve started moving metric calculations to the new flow — about 10% are already working in our internal setup.
It’s been smooth so far, and we’re excited to keep going.
Once all the key metrics are moved, we’ll be ready to switch the whole product to the new backend.
Check out the product’s roadmap – https://jetmetrics.io/roadmap
JetMetrics is currently in a closed beta. Book a 1:1 demo to connect Shopify store.
If you want to grow LTV — don’t start with LTV
In e-commerce, LTV looks like the ultimate goal — big, neat, reassuring.
LTV is the total revenue a customer generates over their relationship (often calculated on contribution margin if you track it).
In simple terms: LTV = ARPPC × Lifetime.
But you can’t move it directly. LTV is a result, not a driver. When teams try to “optimize LTV” as a single number, they end up doing odd things: over-discounting, forcing activations, or hiding margin issues — the dashboard looks better, the business doesn’t.
Our fix is simple: look under LTV, not at it. Break it into parts you can actually manage — AOV, ARPPC, Lifetime — and work the drivers there. That’s the point of our guides and cheat sheets: less mystique around the “super metric,” more clear levers you can pull.


AOV and its drivers
Formula: AOV = Total Revenue ÷ Number of OrdersAOV is the “how much we earn per checkout” number. Nudge it up, and — assuming costs behave — LTV follows.
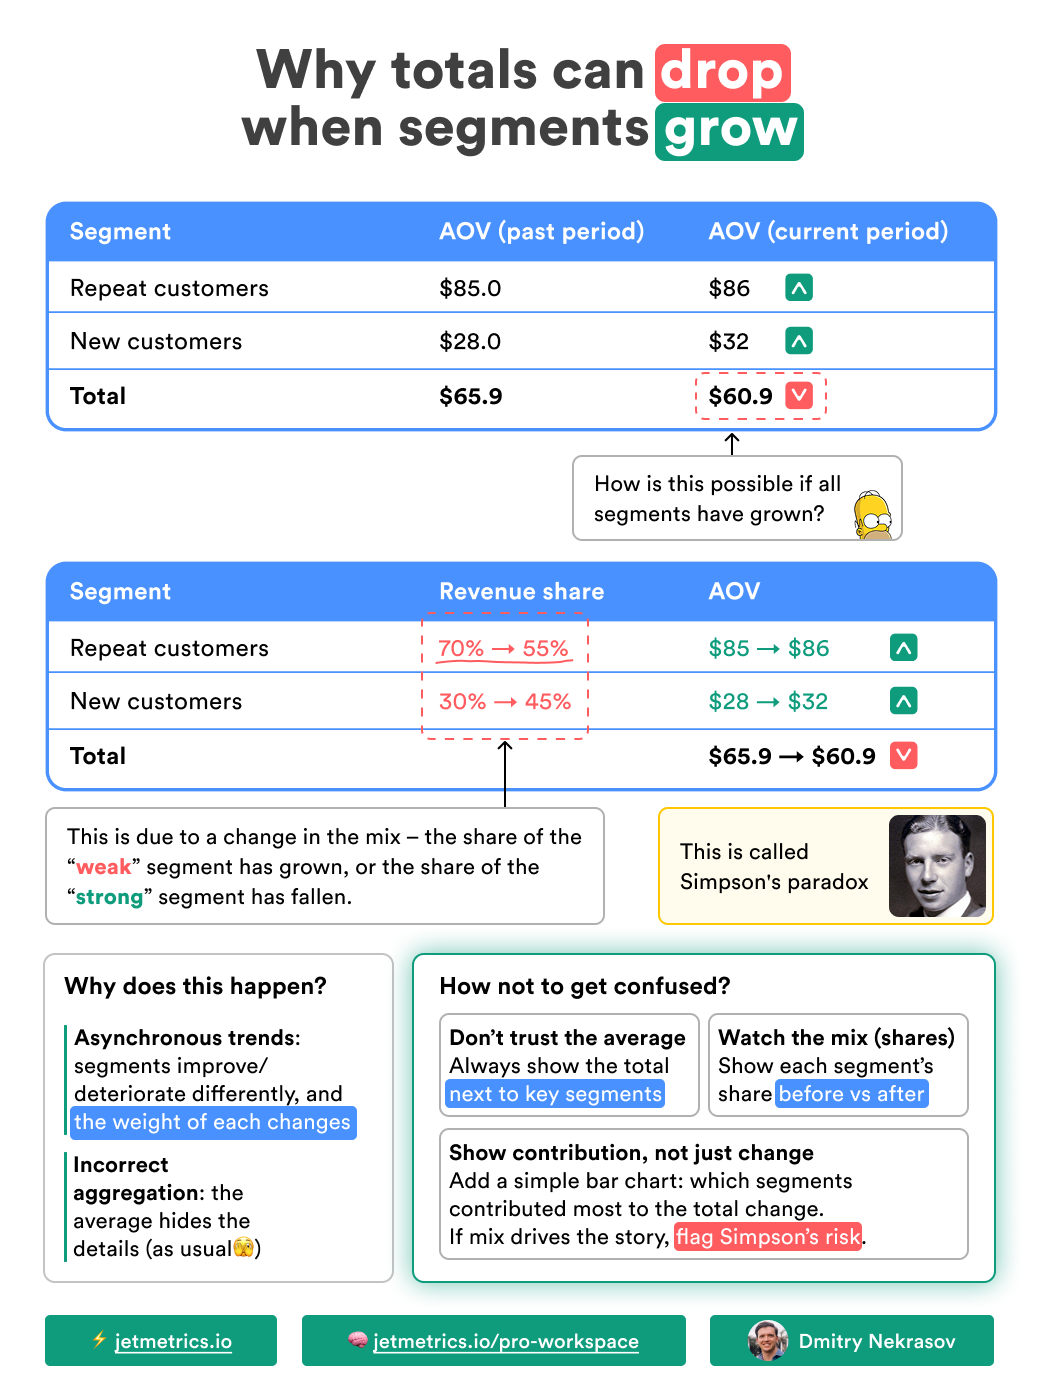
💡Quick check — AOV distribution
Don’t trust the average alone. Scan median AOV and p90 — median shows the typical basket, p90 catches big orders. Average up, median flat — outliers; both up — broad shift.
Read more: Averages are lying to you — here’s what to use instead
But AOV isn’t a single knob; it’s a small control panel. Tweak the right switches and the total moves.
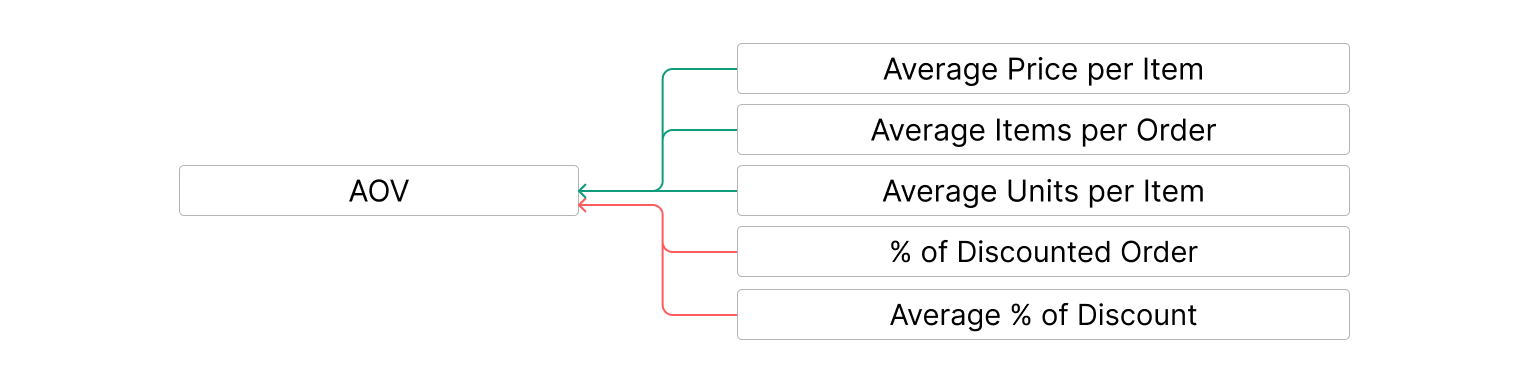
Average Price per Item
Formula: Average Price per Item = Revenue ÷ Number of Items SoldThink of this as the “typical price tag.” Raise perceived value, introduce a premium line, clean up pricing leaks — and AOV climbs. No magic, just positioning and discipline.
Average Items per Order
Formula: Average Items per Order = Total Items Sold ÷ Number of OrdersMore things in the cart, bigger bill. Define what counts as an item in reporting (line items vs. distinct SKUs). Exclude returned items to avoid inflating the metric, and keep the definition stable over time so trends stay comparable.
Classic plays: cross-sell blocks that actually match, simple bundles, and “2+ items” nudges. Keep it obvious; surprise-and-delight works, surprise-and-confuse doesn’t.
Average Units per Item
Formula: Average Units per Item = Total Units Sold ÷ Number of Items (distinct SKUs)This is the “same SKU, multiple pieces” effect — two candles, three tees, a family pack. Multi-packs and volume breaks do the heavy lifting here. It’s Costco energy, just sized for DTC
% of Discounted Orders
Formula: % Discounted Orders = Orders with Discount ÷ Total OrdersWhen too many checkouts ride on a promo, AOV thins out. Set a clear discount flagging rule: coupon, auto-applied promo, subscription base discount, or markdown price on PDP.
Aim for targeted, time-boxed incentives — not a permanent “SALE” sticker. Discounts are a spice, not a base.
Average % of Discount
Formula: Average Discount % = Total Discount Amount ÷ Total Full-Price ValueDeeper cuts = slimmer AOV. Cap depth, earn the add-to-cart with value (loyalty perks, bundles, small bonuses). Save the chainsaw for clearance — everyday pricing should use a scalpel.
ARPPC and its drivers
Formula: ARPPC = Revenue from Paying Customers in Period ÷ Number of Paying Customers in PeriodARPPC shows how much revenue, on average, one paying customer brings per unit of time — usually per month. It’s the spend rate. Raise it, and LTV grows.
Part of ARPPC comes from AOV — bigger baskets lift the monthly contribution — but beyond basket size it also depends on how many customers buy in-period, how often they purchase, and how quickly they repeat.

Customer Penetration
Formula: Customer Penetration = Average Distinct Products (or Categories) Purchased per Customer ÷ Total Products (or Categories) in AssortmentHow much of your assortment an average buyer has adopted. If you sell 10 products and the average customer buys 5, penetration is 50%. Calculate at SKU level or by broader categories — pick what matches real shopping behavior.
Higher penetration lifts ARPPC — more adopted products mean more buying occasions and fewer single-SKU dependencies. It also deepens loyalty, which matters for LTV — the more categories a customer buys from, the stickier the relationship becomes, switching feels costlier, and churn risk drops.
Move it with better discovery and gentle guidance: collections, “complete the set” blocks, smart PDP and cart cross-sell, sample kits, cross-category bundles, and post-purchase flows that introduce the next logical product.
Purchase Frequency
Formula: Purchase Frequency = Orders from Paying Customers in Period ÷ Number of Paying Customers in PeriodHow many orders, on average, each paying customer places within the period. More orders per person = higher ARPPC. Think reorder triggers, subscriptions, post-purchase sequences, and small “come back soon” reasons that don’t feel like a chore.
Order Gap
Formula: Order Gap = Days in Period ÷ Purchase FrequencyAverage time between purchases. Shorter gaps bring customers back faster, which lifts their contribution in the month. Tighten the cycle with predictable replenishment, dependable delivery, and timely reminders that feel well-timed — not pushy.
Lifetime and its drivers
Formula: Lifetime = 1 ÷ Churn Rate (for the chosen period)Lifetime is the span a customer keeps buying from you — months, quarters, whatever unit you track. Extend the span and — with ARPPC steady — LTV compounds. It’s the time side of the equation.

Churn Rate
Formula: Churn Rate = Customers Who Became Inactive in Period ÷ Customers Active at Start of PeriodIn e-commerce, churn is harder to observe than in SaaS — there’s no explicit “cancel.” Teams usually define inactive via a time threshold based on typical buying cadence. A practical rule of thumb: take your Order Gap (from the ARPPC block) and set inactivity ≈ 3 × Order Gap. If a customer hasn’t ordered by that point, mark them inactive, and use that status to compute churn for the period.
Lower churn means a longer Lifetime. Protect it with the undefeated basics — reliable delivery, consistent quality, clear sizing and returns, fast support — plus timely win-backs before that inactivity threshold hits.
Recency
Formula: Recency = Days Since Last OrderRecency is your early-warning light. As days since last order climb, churn risk rises.
Pull the curve down with well-timed nudges — replenishment reminders before expected depletion, browse-triggered messages, small “come back soon” incentives, and fresh reasons to return that don’t rely on heavy discounts. Keep momentum — shorter recency today tends to extend Lifetime overall.
Final thoughts
LTV is the score on the board, not the playbook. On its own, it doesn’t tell you what to do — it only sums up the results of everything else. To make it grow, you need to break it down into AOV, ARPPC, and Lifetime, then zoom into the drivers behind each. That’s where the real levers live, and that’s where action turns into impact.
If you take one thing from this piece, let it be this: don’t chase LTV as a single number. Chase the drivers, and LTV will follow.
LinkedIn post of the week
Update of the week
We’ve updated our Looker Studio collection — it now includes 555 dashboards from 57 authors across 68 data sources.
And 74% are free-to-copy, so you can not only test them with your data but also keep the ones you like.

Happy analyzing 🫶
See you next week!
Dmitry from JetMetrics