

Revenue is down — but traffic is stable. Where to look next?
This guide helps you analyze conversion rate, AOV, and ARPU with practical tips to find the real cause.

It’s not always about traffic
When revenue drops, the first thing many teams check is traffic. And that’s fair — acquisition drives growth, and traffic is easy to monitor.
But sometimes, traffic holds steady (or even grows)… while revenue goes in the opposite direction. And that’s when things get confusing.
In these cases, it helps to step back and remember: revenue doesn’t depend on traffic alone. It’s the result of several metrics working together — and if one of them slips, revenue follows.
We’ll look at three key metrics — conversion rate, AOV, and ARPU — and help you figure out how to read them when revenue drops but traffic doesn’t.
Revenue ≠ just traffic
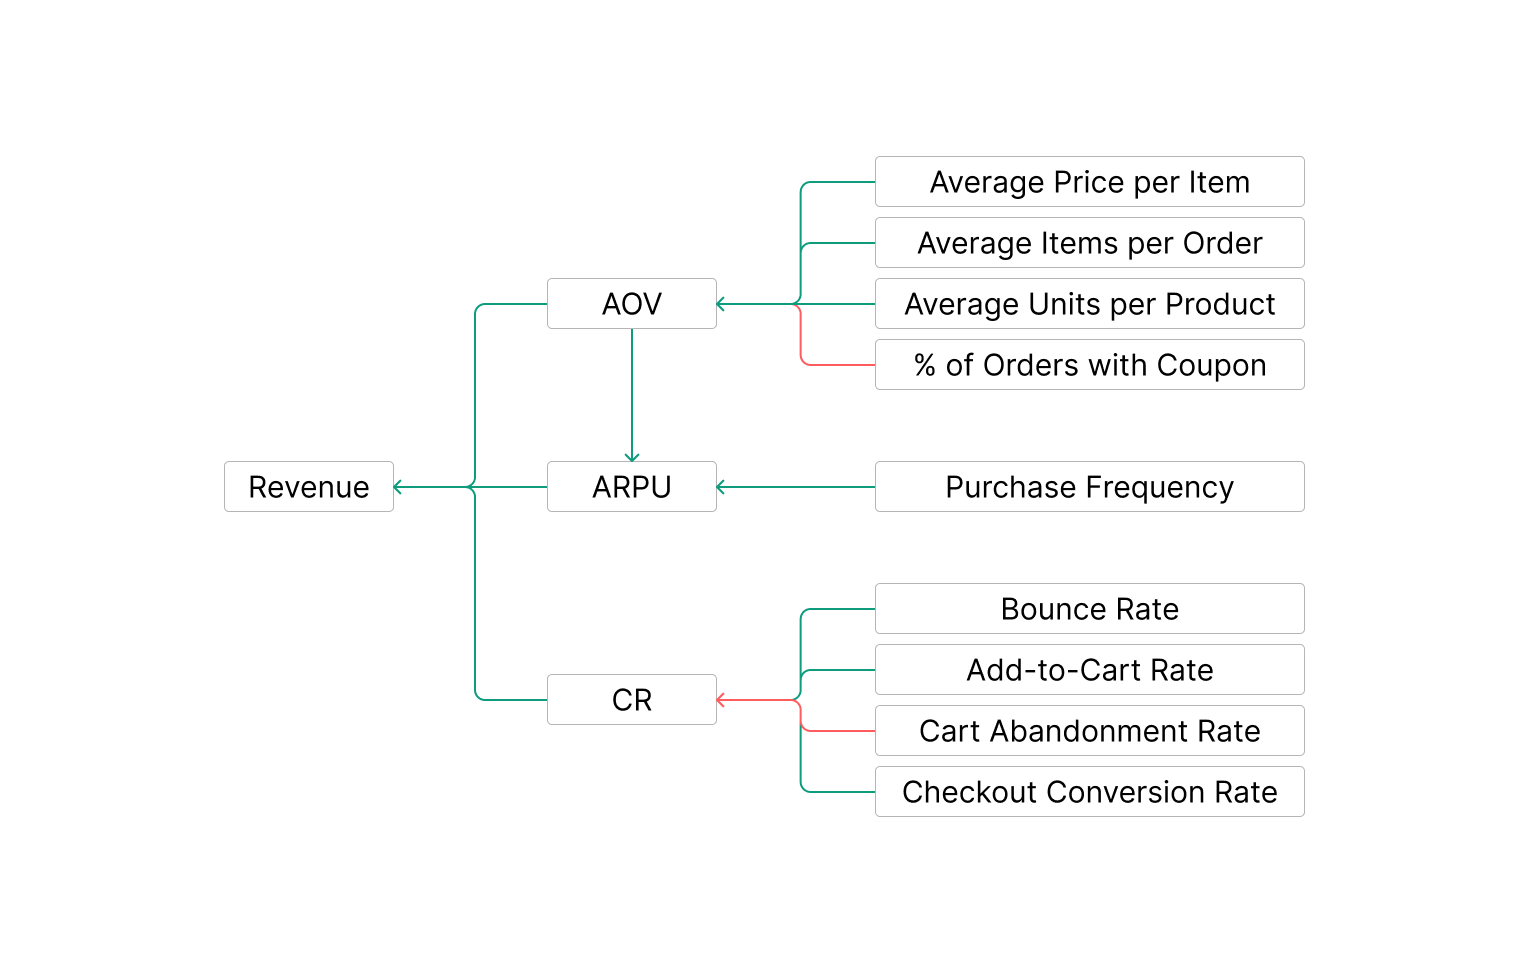
Revenue can be broken down in different ways, and even the formulas show it’s not all about traffic.
In e-commerce, here are three of the most common ways to calculate revenue:
Here are three common formulas:
Sessions × Conversion Rate × AOV
(How much traffic you get × how well it converts × how much people spend per order)
Number of Orders × AOV
(How many purchases happen × what’s the average value per order — aka AOV)
ARPU × Active Customers
(How many active customers you have × how much revenue each brings in on average — that’s your ARPU)
Each of these gives you a different lens. And when traffic looks fine but revenue doesn’t, one of these components is probably to blame.
Let’s break them down one by one.
Diagnosing Conversion Rate when revenue drops
Formula: CR = Orders / Sessions
Conversion Rate shows how many of your website sessions turn into actual orders. It’s a core efficiency metric — the higher your CR, the more value you get from the same traffic.
Even if traffic stays flat, a drop in CR can lead to a significant revenue dip. That’s why it’s the first place to look when traffic is stable but revenue falls.
Let’s explore the key drivers that influence CR and how to investigate them.
1. Bounce Rate
Formula: Bounce Rate = Low engagement sessions / Total Sessions
The percentage of sessions where users view only one page and leave without taking further action. A rising bounce rate often signals a mismatch between visitor expectations and the first page they land on — usually a product or landing page.
CR ↓ + Bounce Rate ↑
Mismatch between ads and landing page:
Identify traffic sources or ad creatives with the highest bounce rate. Compare them to others — do they overpromise or mislead?
Low mobile performance:
Segment bounce rate by device. A spike in mobile bounce rate may suggest design or usability issues.
Irrelevant audience targeting:
Segment bounce rate by campaign or audience. High bounce from specific audiences may indicate poor targeting.
2. Add-to-Cart Rate
Formula: Add-to-Cart Rate = Sessions with Add to Cart / Total Sessions
The share of sessions where a product was added to the cart. It shows whether users are interested enough to start a purchase journey.
CR ↓ + Add to Cart Rate ↓
Unattractive product presentation or info:
Compare product pages with high vs. low ATC rate — look at image quality, descriptions, and reviews.
Price resistance:
Segment ATC rate by price range. A drop in higher-price segments may indicate a value mismatch.
Poor product availability (e.g., sizes):
Analyze ATC rate by variant availability — low ATC on out-of-stock or low-stock SKUs suggests missed opportunities
3. Cart Abandonment Rate
Formula: Cart Abandonment Rate = (Add-to-Cart Users – Purchase Users) / Add-to-Cart Users
The % of users who add a product to the cart but don’t complete the purchase. A high abandonment rate means people show intent by adding to cart, but something stops them before they buy.
CR ↓ + Cart Abandonment Rate ↑
Lack of checkout triggers or CTAs:
Analyze heatmaps or clicks on the cart page. Low interaction with checkout buttons may indicate weak visual cues.
Promo code dependency:
Check whether sessions drop when no valid promo code is applied. Analyze % of users who start checkout only when discounts are available.
Low trust or uncertainty:
Survey exit-intent users (or analyze user session recordings) for hesitation signals. Alternatively, test trust badges or reviews near CTA.
4. Checkout Conversion Rate
Formula: Checkout CR = Orders / Checkout Sessions
The % of checkout sessions that result in a completed purchase. A low checkout CR suggests friction at the final step — a key conversion blocker.
CR ↓ + Checkout Conversion Rate ↓
Limited payment/shipping options:
Segment checkout CR by region. If it’s low in certain countries, check available payment methods or shipping policies.
Technical issues or errors:
Track failed transactions or user error logs. Anomalies often show up as sudden dips.
Unexpected costs at checkout:
Compare product page price vs. final checkout total. Sudden increases (e.g., shipping or tax) often trigger drop-offs.
AOV: Troubleshooting average order value drops
Formula: AOV = Revenue / Orders
Average Order Value tells you how much revenue you earn from each order on average. It’s influenced by what people buy, how much they buy, and how heavily they use discounts.
When traffic and conversion are steady, but revenue drops, a lower AOV is often the missing link. It’s a signal that either basket sizes are shrinking, product prices are lower, or discounts are too aggressive.
Let’s explore the key components that shape AOV.
1. Average Price per Item
Formula: Average Price per Item = Revenue / Total Items Sold
The average price paid per product in an order, before accounting for quantity or number of items.
A drop in average item price can pull AOV down, even if customers are buying the same number of items. This often happens when product mix shifts, discounts get deeper, or premium items stop performing.
AOV ↓ + Average Price per Item ↓
Deeper discounts were applied
Check average discount % over time or across major SKUs. If high-discount products are driving more sales, it likely explains the drop.
More low-priced items are being purchased
Segment product sales by price tier. A rising share of low-cost items can dilute the average.
High-end products are underperforming
Track the revenue share of premium items across time. If their contribution shrinks, your average price will too.
2. Average Items per Order
Formula: Average Items per Order = Total Items Sold / Orders
The average number of different products included in a single order.
This metric shows how many distinct products a customer includes in one checkout. If it drops, customers are buying fewer types of items, which can shrink the total order value.
AOV ↓ + Average Items per Order ↓
Cross-sell strategies aren’t working
Compare add-to-cart behavior between sessions with vs. without product recommendations. A flat difference may point to ineffective pairings.
Frequently paired items are out of stock
Review the availability of top bundle combinations. Gaps in inventory often lead to slimmer orders.
Less variety is shown or promoted
Analyze changes in site navigation or homepage promotions. Narrow assortments reduce multi-item purchases.
3. Average Units per Product
Formula: Average Units per Product = Total Units / Unique Items Sold
The average quantity purchased per item, for example, 3 units of the same product. If this metric drops, customers are buying fewer multiples, reducing the total number of units (and revenue) per order.
AOV ↓ + Average Units per Product ↓
Bulk deals aren’t converting
Compare pre- and post-offer performance on quantity-based promotions. If uptake is low, try A/B testing value thresholds or placement.
Bundles aren't appealing
Review CTR and conversion for bundle offers. Declines may suggest poor perceived value or mismatched pairings.
Customers don’t reach free shipping minimums
Plot the distribution of order values. If many fall just short of a shipping threshold, consider adjusting it or offering more upsell nudges.
4. % of Orders with Coupon
Formula: % of Orders with Coupon = Orders with Coupon / Total Orders
The share of total orders that used a discount code. A spike in coupon usage means more orders are discounted, which pulls down AOV. This isn’t always bad, but if unplanned, it can erode the margin fast.
AOV ↓ + % of Orders with Coupon ↑
Too many codes are publicly available
Audit affiliate sites or Google search results for working codes. Public leaks of high-value promos often distort AOV.
High-value codes aren’t restricted
Analyze how often large discounts are applied by new vs. existing customers. Consider gating or expiring old codes.
Customers are stacking discounts
Check for multiple applied promos per order. If stacking is allowed, it may be time to revise promo logic.
ARPU: How to detect retention problems with revenue
Formula: ARPU = Revenue / Active Customers
ARPU shows how much revenue you generate from each active customer during a given time period. It's a helpful lens into overall customer value, shaped by both how often people buy and how much they spend.
When traffic and conversion rate are steady, but ARPU drops, it usually means customers are buying less frequently or spending less per order. We've already covered AOV — now let’s look at the second half of the equation: Purchase Frequency.
1. Purchase Frequency
Formula: Purchase Frequency = Total Orders / Active Customers
How many orders an average active customer places within the selected time range.
If customers place fewer orders over time, revenue per user will decline — even if each order is still large. This makes frequency a critical ARPU driver, especially for retention-focused brands.
ARPU ↓ + Purchase Frequency ↓
Email or SMS flows aren’t driving return traffic
Review open and click-through rates for returning vs. one-time buyers. Low engagement may mean your follow-up strategy isn’t working.
No clear reason to come back
Segment active vs. churned customers and compare time since last promo, new product launch, or trigger campaign.
Shipping delays or bad CX discourage reorders
Track reorder rate across shipping methods or fulfillment times. If delays correlate with lower frequency, you’ve found a friction point.
Final thoughts
When revenue drops but traffic doesn’t, it’s tempting to assume it’s just a blip — or to wait and hope it bounces back.
But often, the real reason is hiding in plain sight — inside your metrics.
By breaking revenue down into Conversion Rate, AOV, and ARPU, you can pinpoint what’s changed and why. And by digging into the drivers behind each one, you’re not just spotting the issue — you’re building a clear, data-backed path to fixing it.
Looking across all three metrics, one pattern stands out: revenue issues rarely come from a single source. It’s often a combination — a small drop in conversion here, a subtle shift in product mix there.
That’s why dashboards with only top-line numbers often miss the point. To really understand your revenue, you need structure. A map. A system.
FAQ: Revenue drops when traffic is stable
Why is revenue down if my website traffic is stable?
Because traffic alone doesn’t drive revenue. Drops in conversion rate, average order value (AOV), or repeat purchase behavior can easily outweigh steady traffic.
What’s the difference between AOV and ARPU?
AOV = Revenue per order
ARPU = Revenue per user
You can have a high AOV but low ARPU if customers only buy once.
See 1100+ e-commerce metrics explained in our JetMetrics Lite knowledge base.
How do I reduce cart abandonment in Shopify stores?
Focus on:
Reducing unexpected fees at checkout
Adding trust elements (reviews, payment icons)
Offering nudges like free shipping thresholds
What metrics should I check first when revenue declines?
Start with:
Conversion Rate — are people still buying?
AOV — are they spending the same amount?
ARPU — are repeat purchases stable?
How do I know if the problem is discounting or pricing?
Check:
Change in average item price
% of orders with coupon
Price tier shift in bestsellers
What if my conversion rate looks fine, but revenue still drops?
Then AOV or ARPU is likely the issue. Look for:
Smaller basket sizes
More coupons used
Fewer repeat orders