


Table of contents:
JetMetrics App update
Article
Guide of the week
Post of the week
Promo
JetMetrics App weekly update
We’ve added hover-to-reveal for long names.
You know when product names get cut off like “The Compl…” – and you have to guess what it actually is?
Now you don’t. Just hover, and the full name pops up.
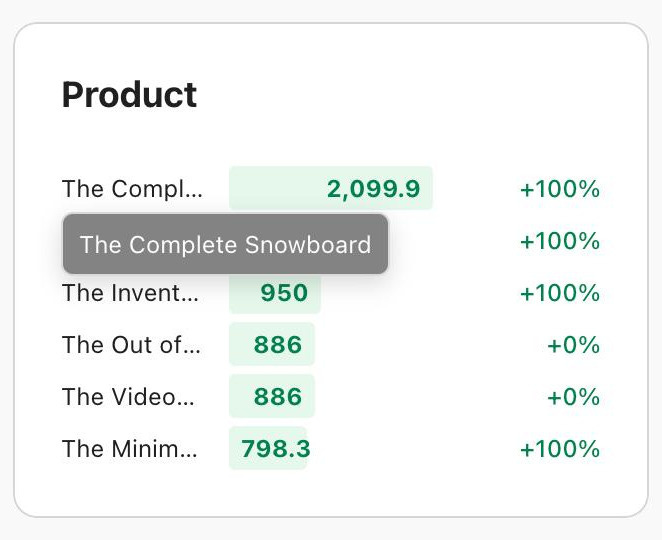
A small thing, but it saves time (and sanity), especially if you're working with longer titles or sharing dashboards with clients.
While we're adding minor improvements on a regular basis, major updates are constantly being worked on. Stay tuned!
Check out the product’s roadmap – https://jetmetrics.io/roadmap
JetMetrics is currently in a closed beta. Book a 1:1 demo to connect Shopify store.
Why AOV dropped even though my product prices didn’t change
You didn’t change your prices.
You didn’t run a big discount.
And yet, your average order value (AOV) is down.
It’s not a pricing issue. It’s a pattern issue.
And if you’re only looking at price tags, you’ll miss the real problem.
This article breaks down three quiet but common shifts in order structure that drive AOV down, and what to do about each one.
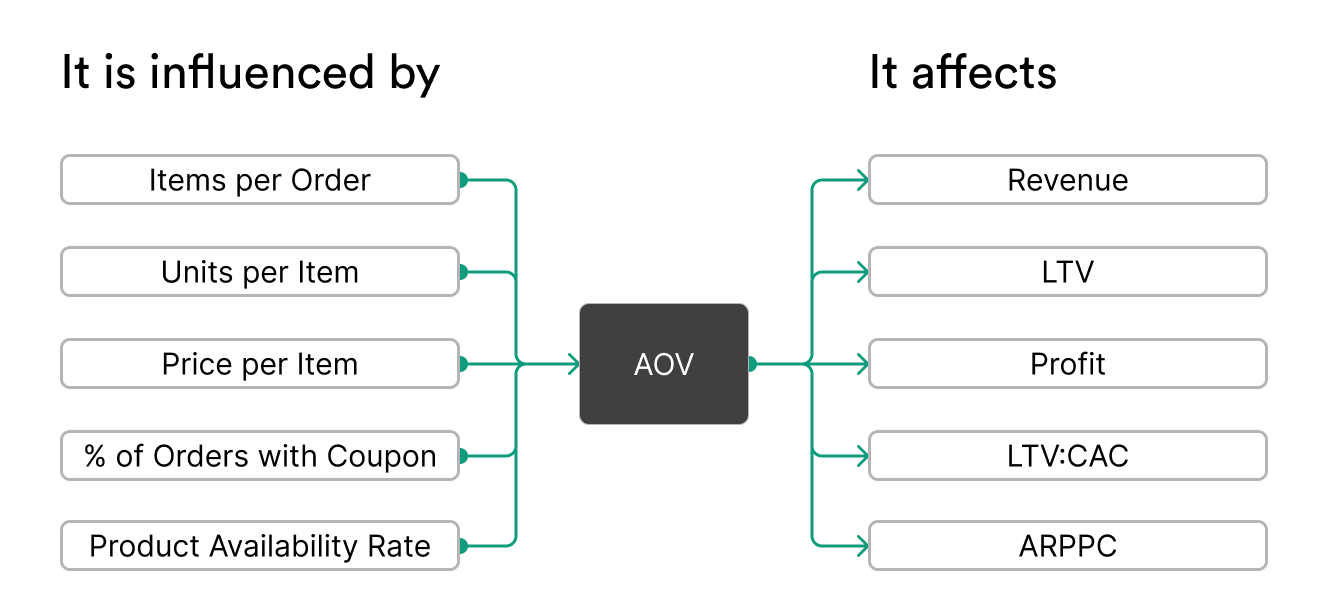
AOV isn’t about prices. It’s about order patterns
AOV doesn’t change because of prices. It changes because of patterns.
Fewer items per order.
Smaller bundles.
A surge of one-product carts.
A dip in big-spender behavior.
When those shifts happen, your average drops, even if your prices don’t.
That’s why AOV should be seen not as a price signal, but as a reflection of order distribution.
So instead of asking “What changed in pricing?”, ask:
“What changed in how people build their carts?”
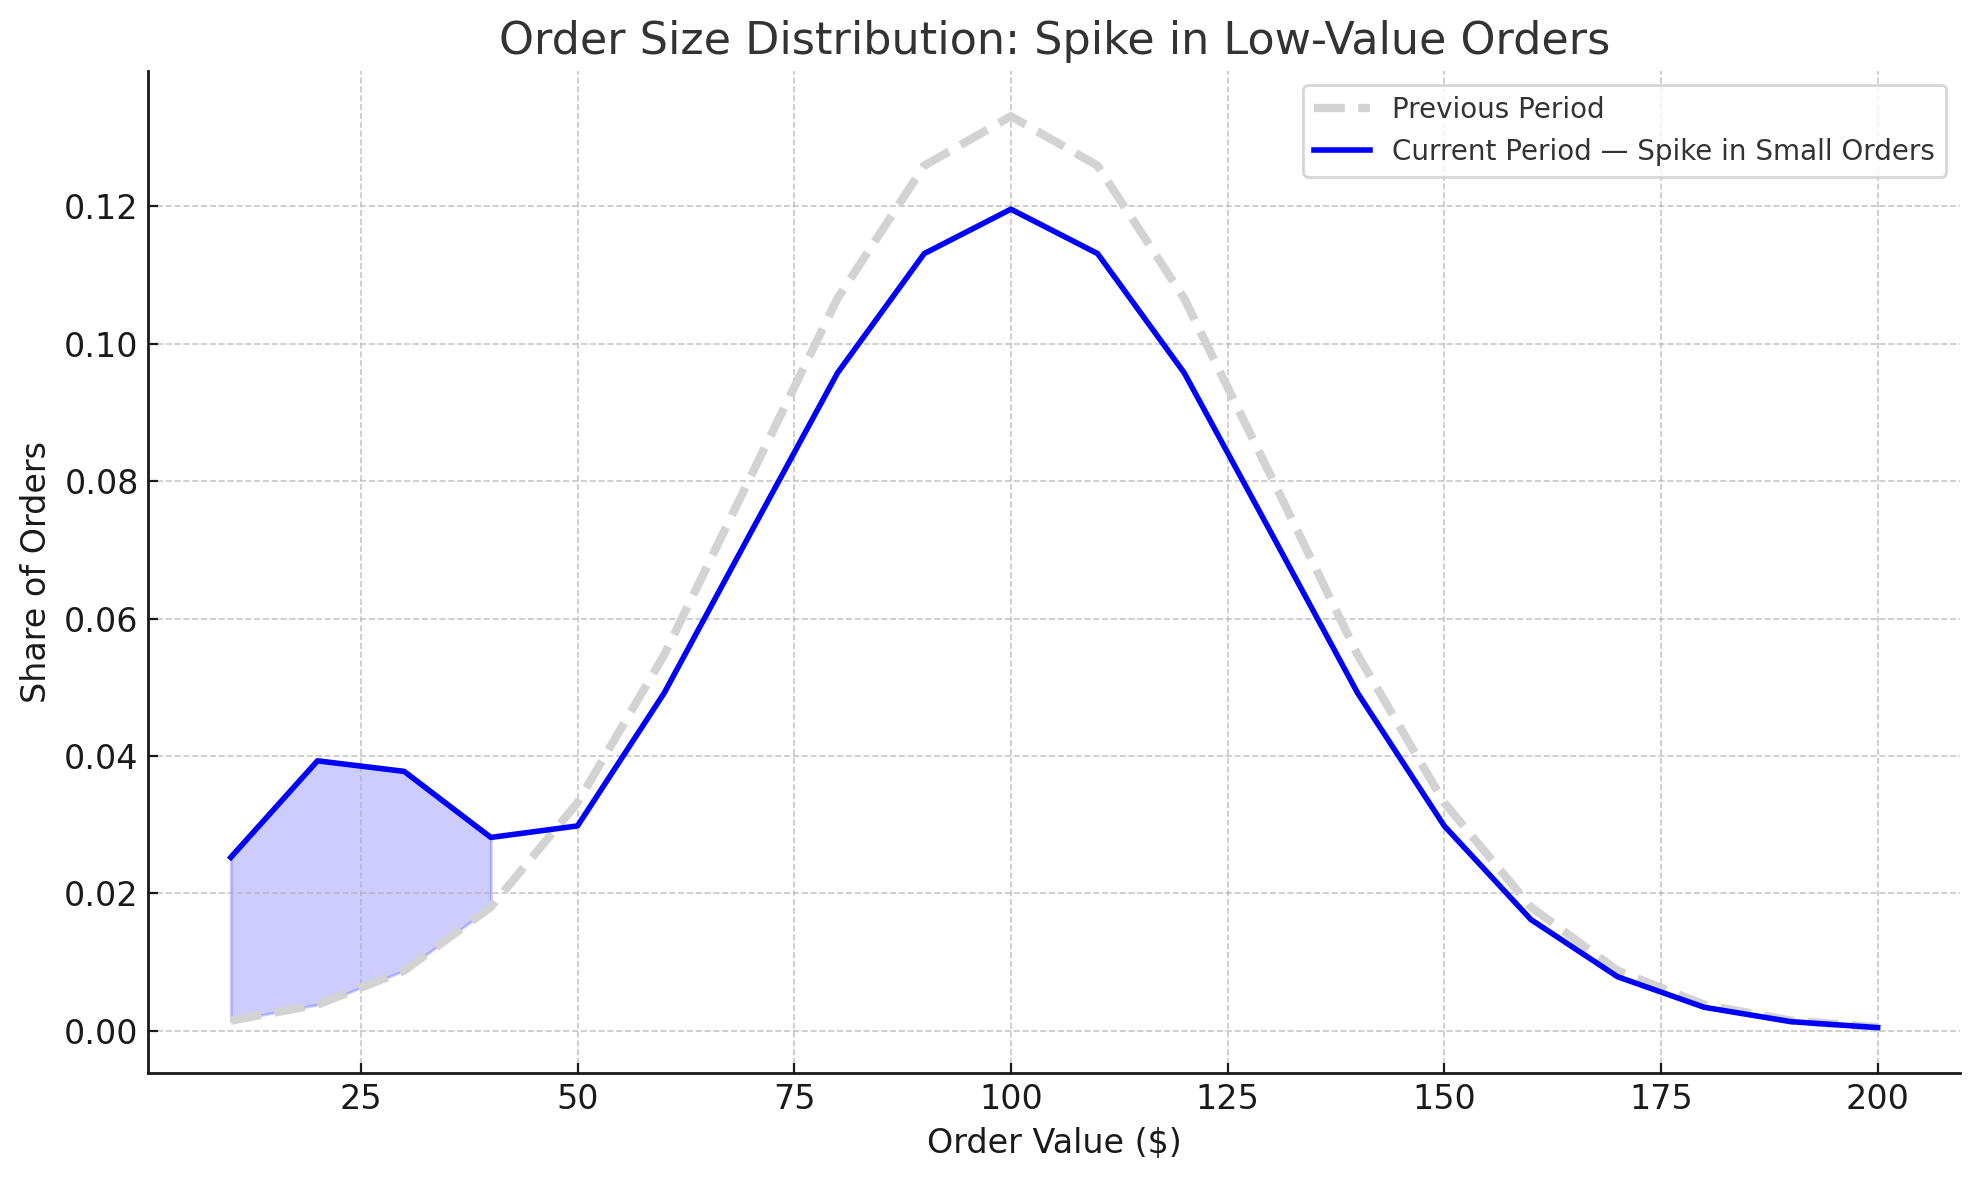
Pattern #1 — A Spike in Low-Value Orders
Average order value can drop even when prices stay the same, simply because more customers are placing smaller orders.
This isn’t about discounts or markdowns. It’s about order composition. If a growing share of your orders are for low-priced items, they’ll pull the average down, even if everything else stays constant.
For example:
Before:
80 orders at $100 = $8,000
20 orders at $40 = $800
AOV = $8,800 / 100 = $88After:
80 orders at $100 = $8,000
40 orders at $40 = $1,600
AOV = $9,600 / 120 = $80
Revenue went up, but AOV fell. And that alone can trigger concern, especially if AOV is a KPI you track closely. That’s why AOV is tricky: it can fall even when revenue grows, because it reflects the average, not the total.
What drives this pattern? Often it’s something intentional: a low-cost product gets featured in a campaign, a coupon encourages minimum-spend purchases, or new traffic from social channels converts on entry-level items.
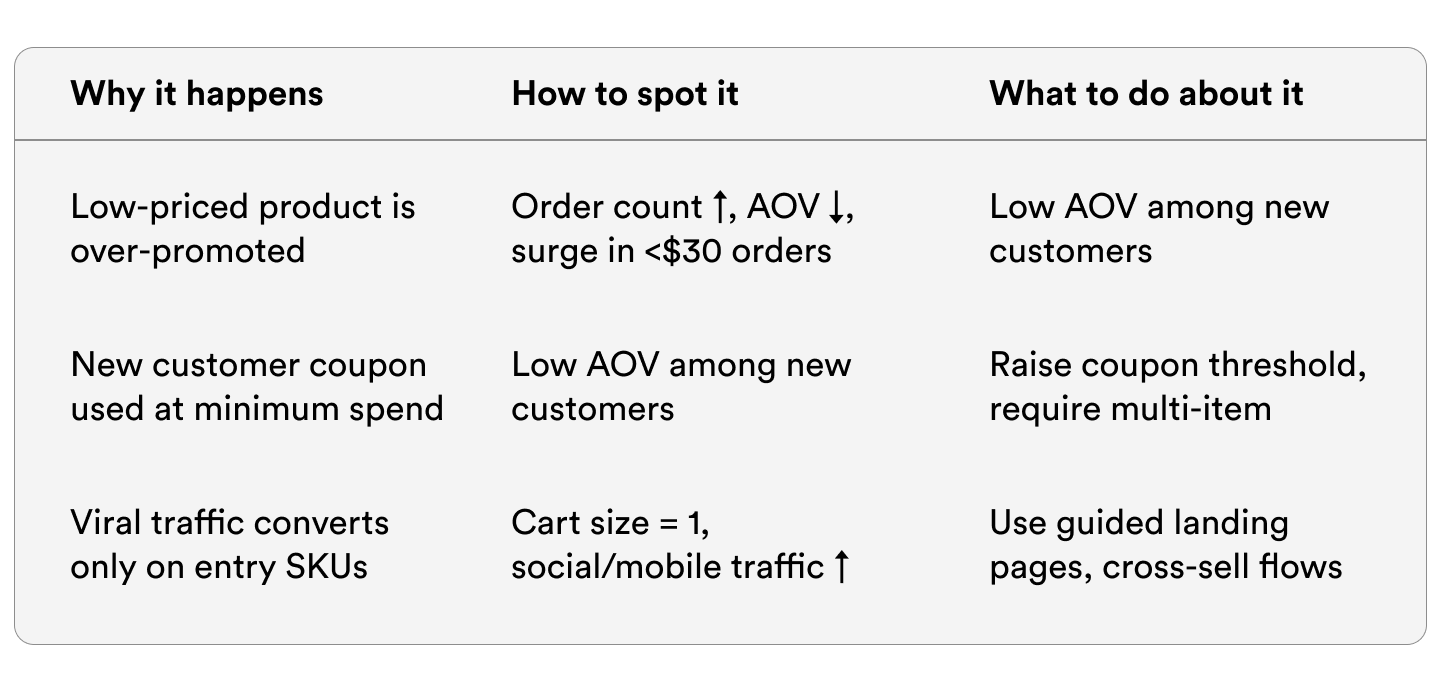
These orders aren’t bad – they can help acquire customers. But if they’re not paired with upsells or follow-up value, they tend to lower margins and retention, and can skew your CAC-to-LTV ratio.
💡 One thing to check:
How many of your customers placed just one order under $30… and never came back?
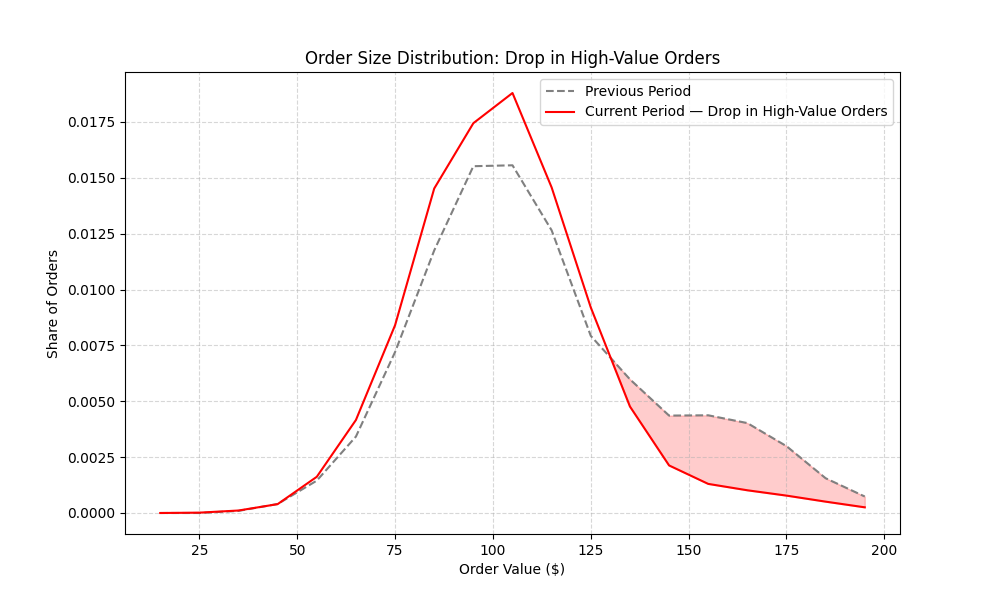
Pattern #2 — A Drop in High-Value Orders
Not all AOV drops come from a surge in small orders. Sometimes the problem is the opposite: your large, high-value orders start to disappear.
These are the orders that used to lift your average — the ones with big carts, bundles, or premium products. When they vanish, even a healthy stream of standard orders can’t hold the AOV up.
Here’s how that shift plays out:
Before:
20 high-value orders at $200 = $4,000
80 standard orders at $80 = $6,400
AOV = $10,400 / 100 = $104After:
10 high-value orders at $200 = $2,000
90 standard orders at $80 = $7,200
AOV = $9,200 / 100 = $92
This kind of drop is easy to miss. Conversion rate might be fine. Revenue might even look stable. But if your most valuable products or customers are missing, AOV takes a quiet hit, and your margins often go with it.
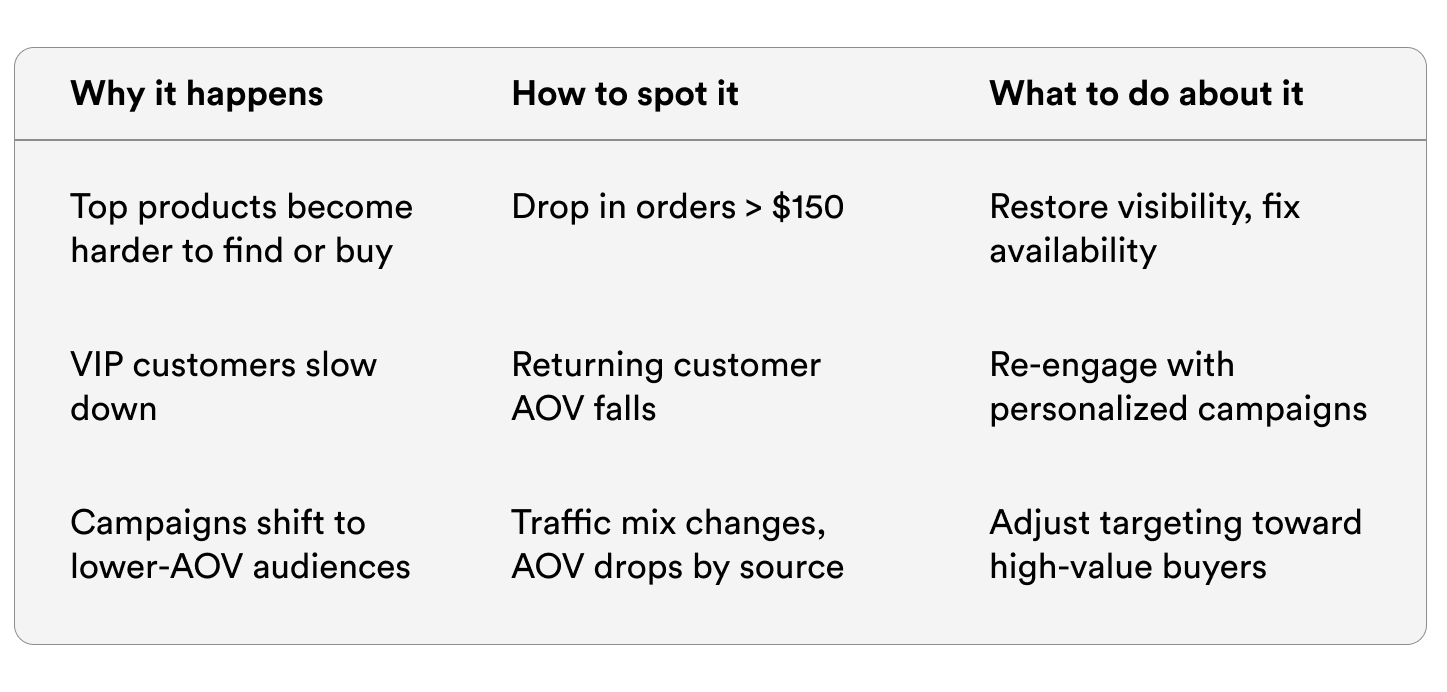
It can happen for many reasons: a popular bundle goes out of stock, a high-ticket item is buried in navigation, or ad spend shifts toward audiences that buy less. In some cases, it’s returning customers who are simply less active than before.
Whatever the trigger, the pattern is the same: you’re no longer getting the orders that kept your average high — and you may not notice until it’s been weeks.
💡 One thing to check:
Which high-value product had the biggest drop in orders last month — and did anyone notice?
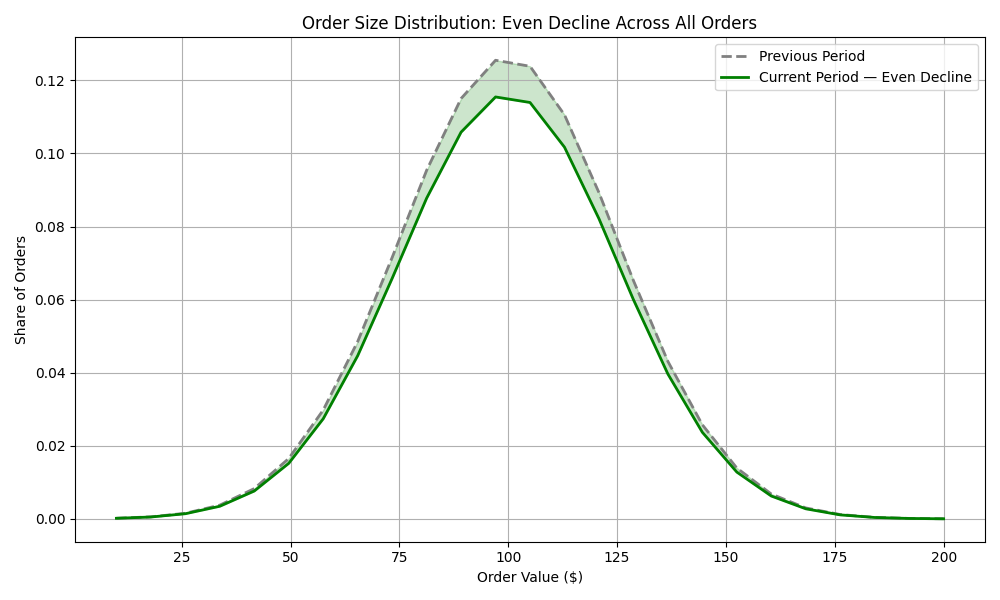
Pattern #3 — A Slow, Even Decline Across All Orders
Not every AOV drop is caused by a change in order mix.
Sometimes, customers across the board just start spending a little less, and the impact adds up quietly.
This isn't about more cheap orders or fewer expensive ones. It’s about the same customers, same products, but smaller carts. Fewer items. Less bundling. Lower-priced combinations.
Here’s how that can look in the data:
Before:
100 orders averaging $90
→ Total revenue = $9,000
→ AOV = $90After:
100 orders averaging $82
→ Total revenue = $8,200
→ AOV = $82
You may check your top products, channels, or segments, and everything looks stable. But when you break it down, you’ll likely notice patterns like these:
Items per order has fallen slightly
Upsell acceptance rates have dropped
Fewer orders exceed the free shipping threshold
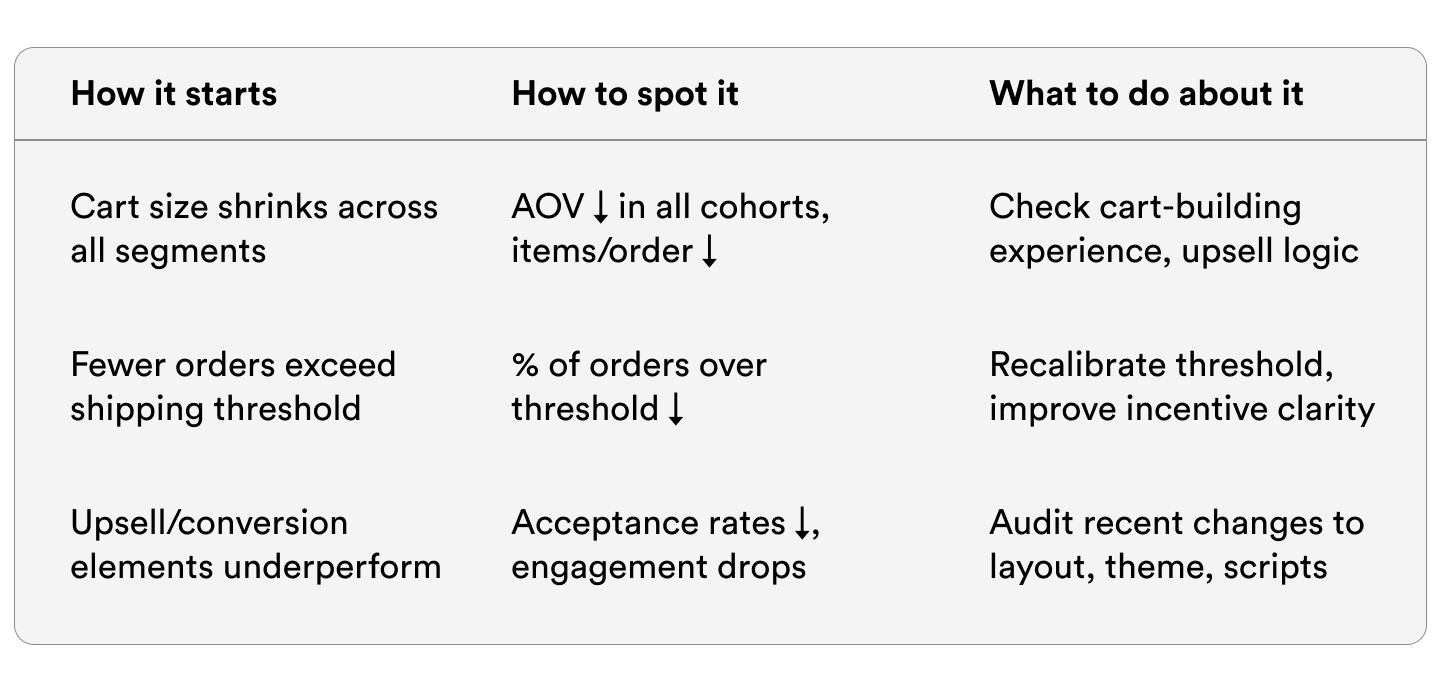
These are early signs that something shifted in how people build their carts.
It could be tied to UX (a broken recommendation block, a checkout tweak, a theme update).
Or to incentives (free shipping no longer feels motivating, promotions have lost clarity).
But the key is: nothing looks broken in isolation — until you zoom out and notice that AOV fell everywhere, just a little.
And that makes it harder to catch, but easier to fix, once you know where to look.
💡 One thing to check:
What % of your orders crossed the free shipping threshold last month, and how does that compare to the month before?
Final Thought — Don’t Treat AOV Drops Like a Pricing Problem
AOV is just one number, but behind it is a story about how people shop, what they value, and how that behavior shifts over time.
When that number drops, it’s rarely about price. It’s about patterns — patterns in carts, in segments, in decisions.
By learning to spot these changes early, you can react faster, test smarter, and avoid costly surprises later.
Guide of the week
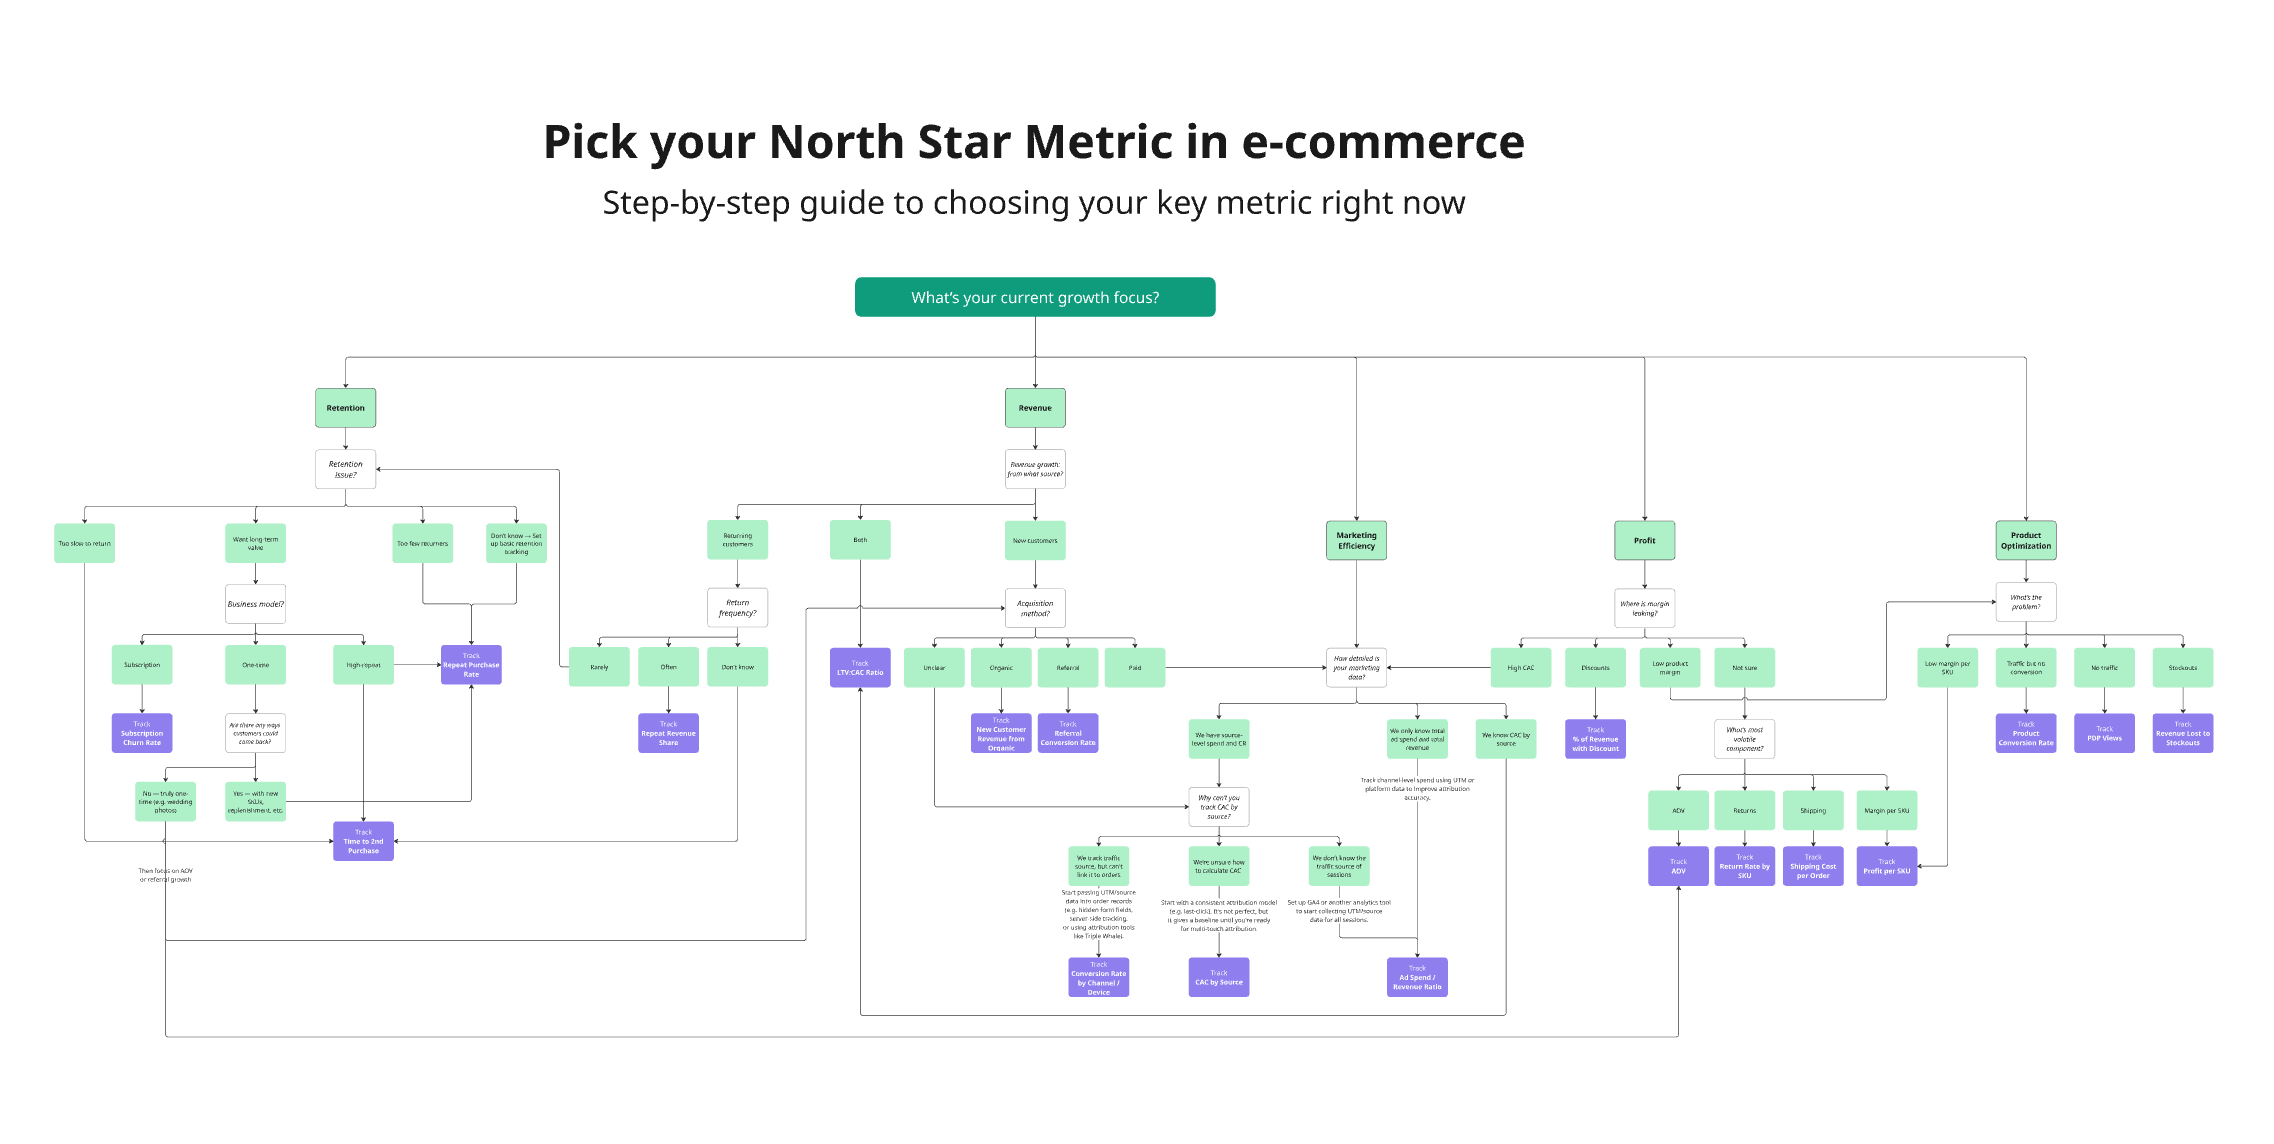
This is a step-by-step decision tree that helps you identify the key e-commerce metric you should focus on right now.
It works like a diagnostic tool:
You start at the top.
Answer simple questions with one clear answer per step — no need to overthink.
Follow the path based on your answers.
You’ll land on the metric that matters most for your current growth challenge.
No fluff. No theory. Just structured logic that leads to actionable focus.
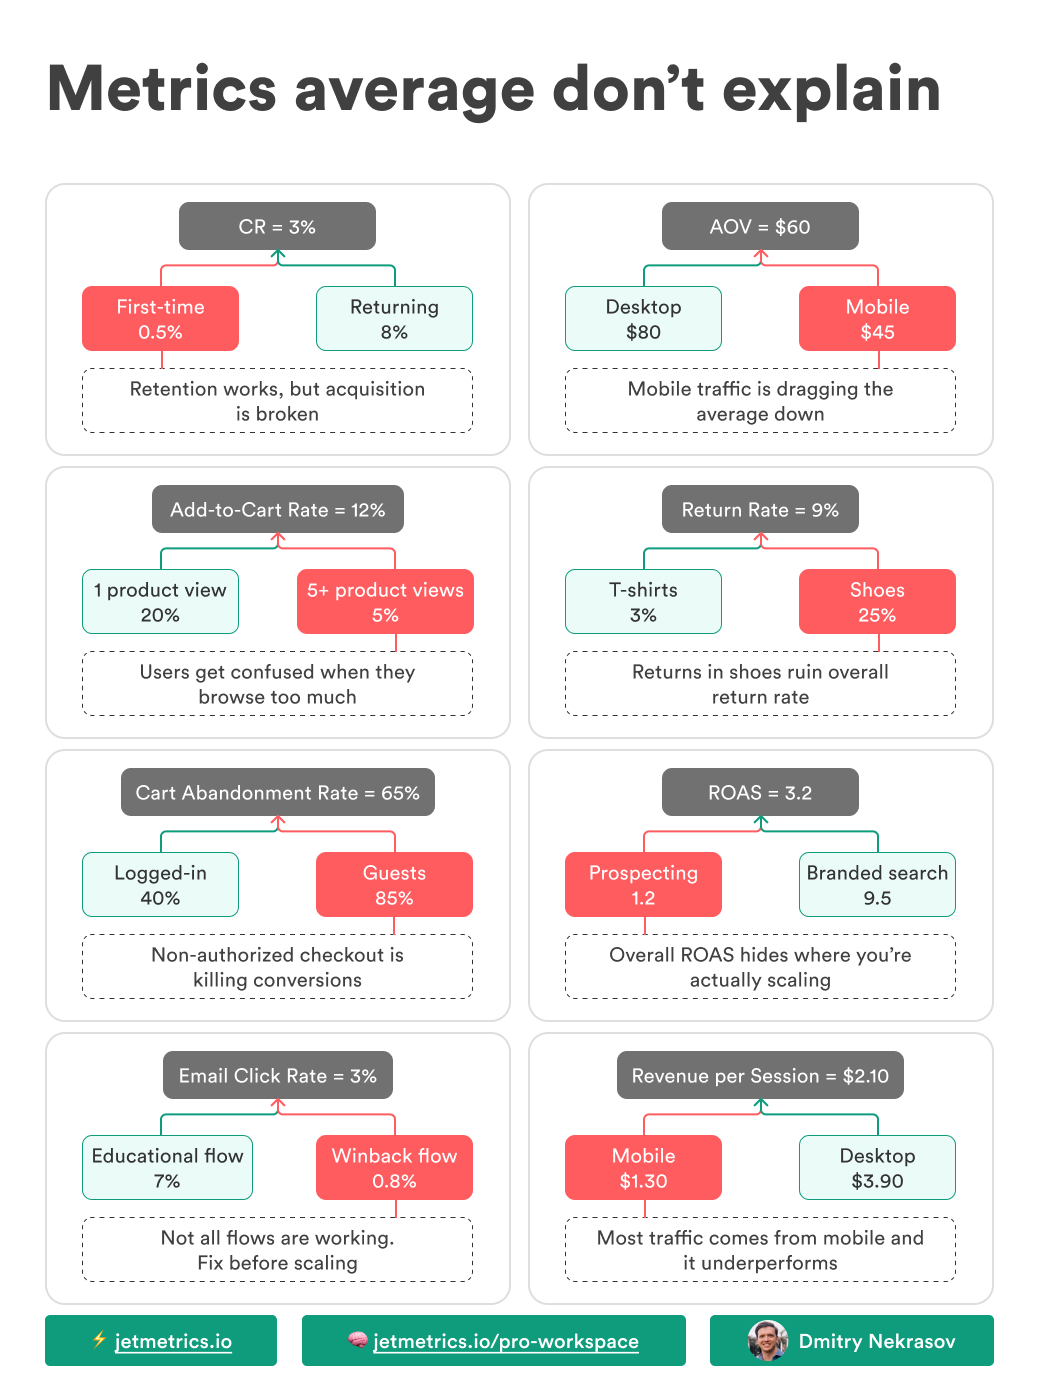
LinkedIn post of the week
Promo of the week
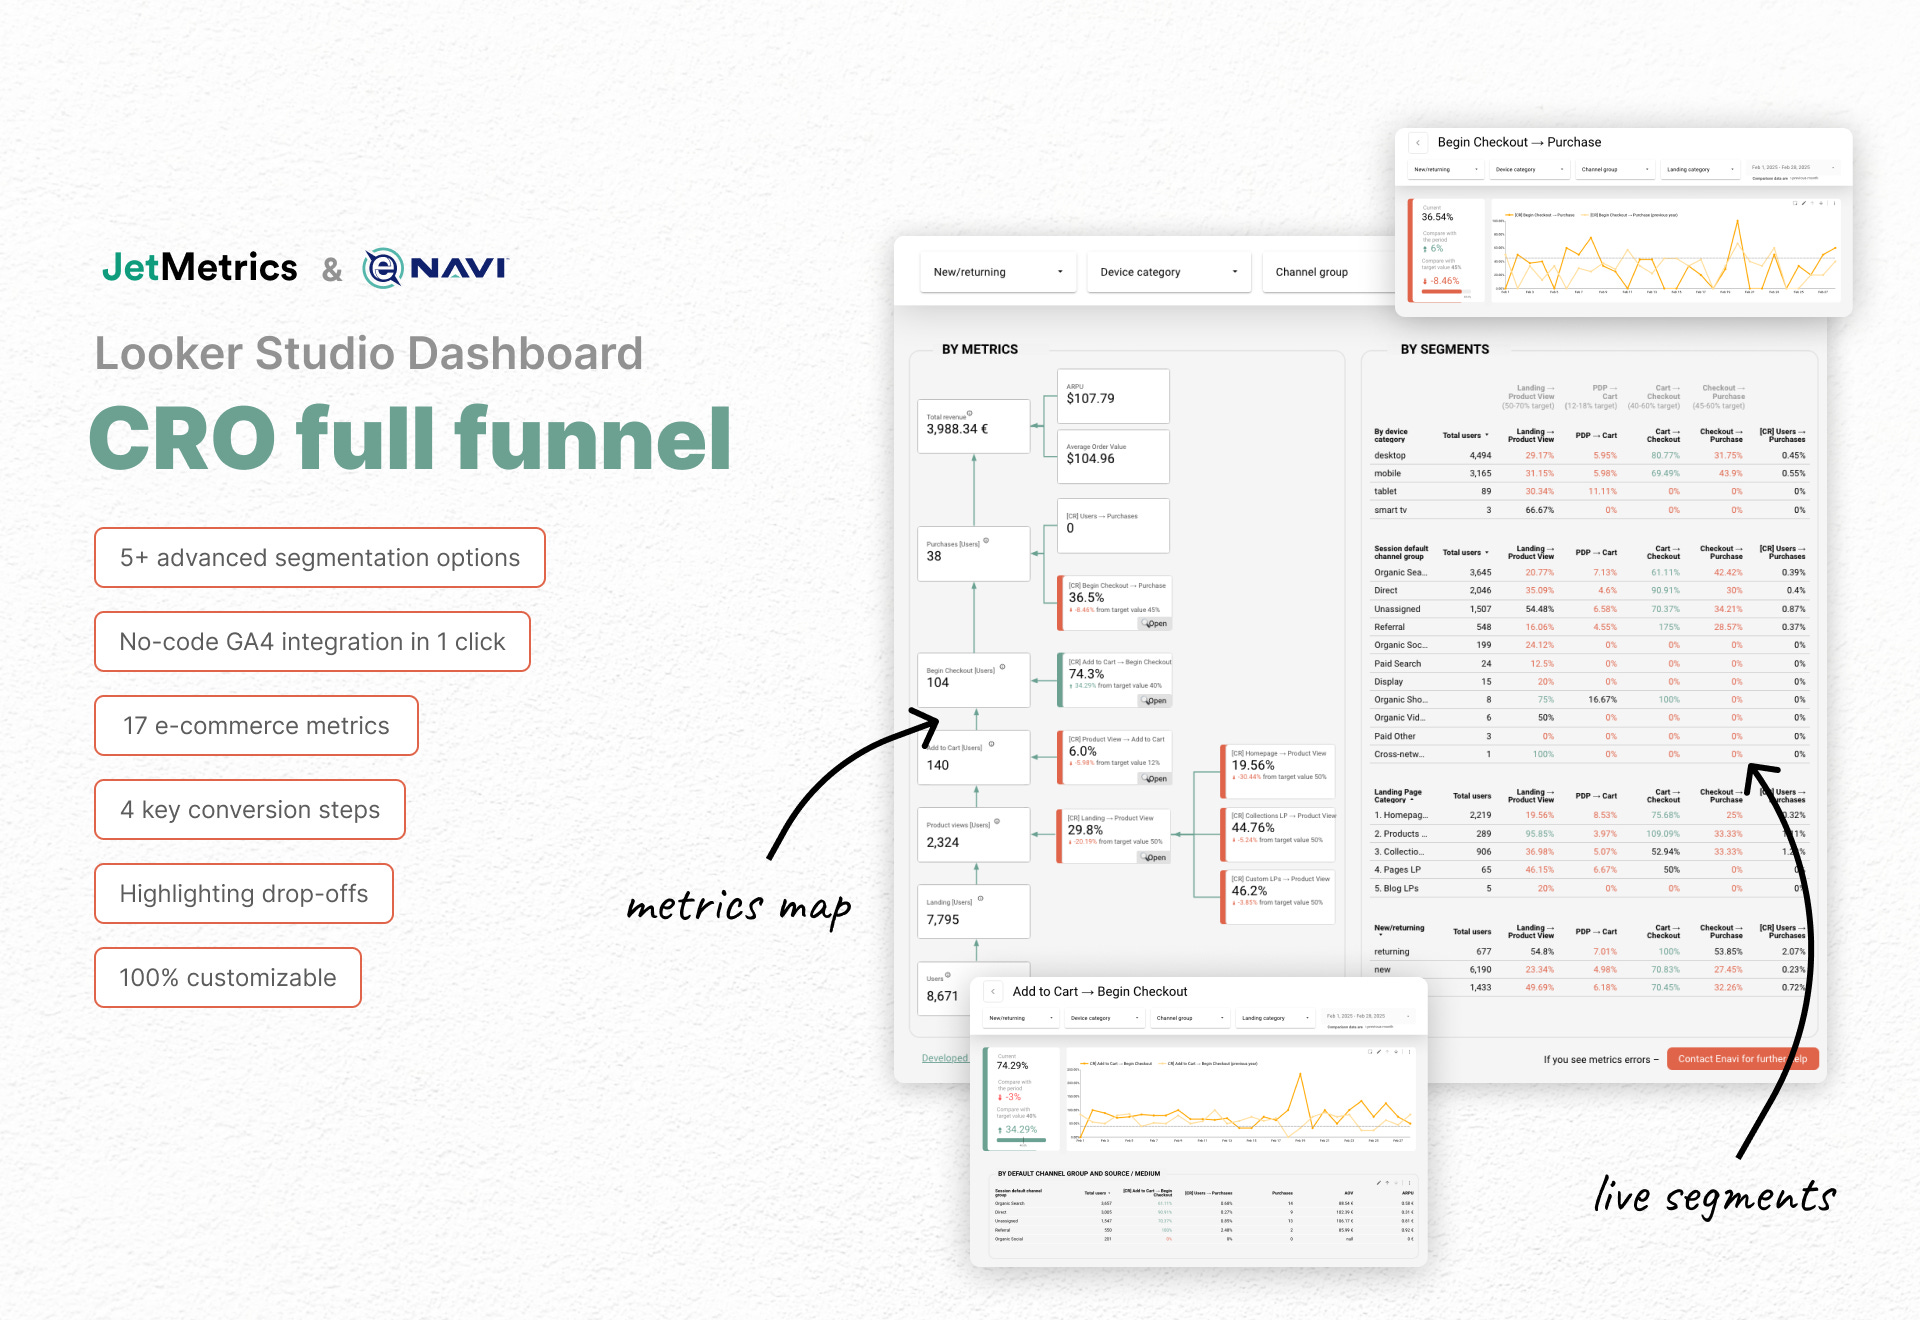
Heads-up: New version = new price
Our popular dashboard – CRO Funnel Dashboard – gets a big update on Wednesday (July 23).
New filters, better segment logic, and a new optional funnel view. You’ll like it.
⚠️ With the update, the price will go up:
$79 → $99 (Full)
$149 → $169 (White-label)
⏳ Grab the white-label version now to get lifetime updates — including this one.
Happy analyzing 🫶
See you next week!
Dmitry from JetMetrics
https://blog.jetmetrics.io/i/168772921/pattern-a-spike-in-low-value-orders
Is it possible to create that chart in looker ? Best we can do is create buckets using switch. But how to get the count/frequency of those order threshold ?
Thanks