


Table of contents:
JetMetrics App update
Article
Post of the week
JetMetrics App weekly update
🧱 Finished restructuring our core data tables
As part of the ongoing backend rebuild, we’ve now completed the new structure for all key data types — stores, customers, products, and orders.
We also added support for updates to past data — for example, if an order info is changed in Shopify after the fact, JetMetrics will now be able to capture that too.
Check out the product’s roadmap – https://jetmetrics.io/roadmap
JetMetrics is currently in a closed beta. Book a 1:1 demo to connect Shopify store.
Why your retention breaks even when RPR looks fine
Everyone knows the acquisition funnel. You don’t just track “conversion rate” — you look at clicks, add-to-cart, checkout, all the little drop-offs along the way.
But when it comes to retention, most teams stop at one number: Repeat Purchase Rate.
That’s like measuring acquisition only by “how many visitors bought”. It tells you almost nothing about where retention actually breaks.
If you rely on it alone, you’ll miss the early signs of churn and the levers that truly drive LTV.
In this article, we’ll walk through the key metrics that reveal the real retention funnel — and how to use them to find (and fix) weak spots.
RPR = the starting point, not the finish line
The first metric almost every e-commerce team looks at when they start measuring retention is Repeat Purchase Rate (RPR). It shows the share of customers who placed more than one order over a given period.
Formula: RPR = Customers with 2+ Orders / Total CustomersIt’s a great entry point. RPR quickly tells you whether customers are coming back at all, and it’s easy to track over time or benchmark against others in your industry. If your RPR is 20% this month and 25% the next, you know something is working.
But here’s the catch: RPR is only the very first signal. On its own, it hides a lot of important details:
It’s binary — only yes/no: did they ever come back?
It hides differences between loyal customers and one-time buyers.
It doesn’t capture timing: a 7-day repeat and a 12-month repeat count the same.
It ignores profitability: full-price repeat and promo-driven repeat look identical.
That’s why RPR should be treated as the starting point of your retention funnel, not the end. To actually understand where retention breaks — and how to fix it — you need to go deeper.
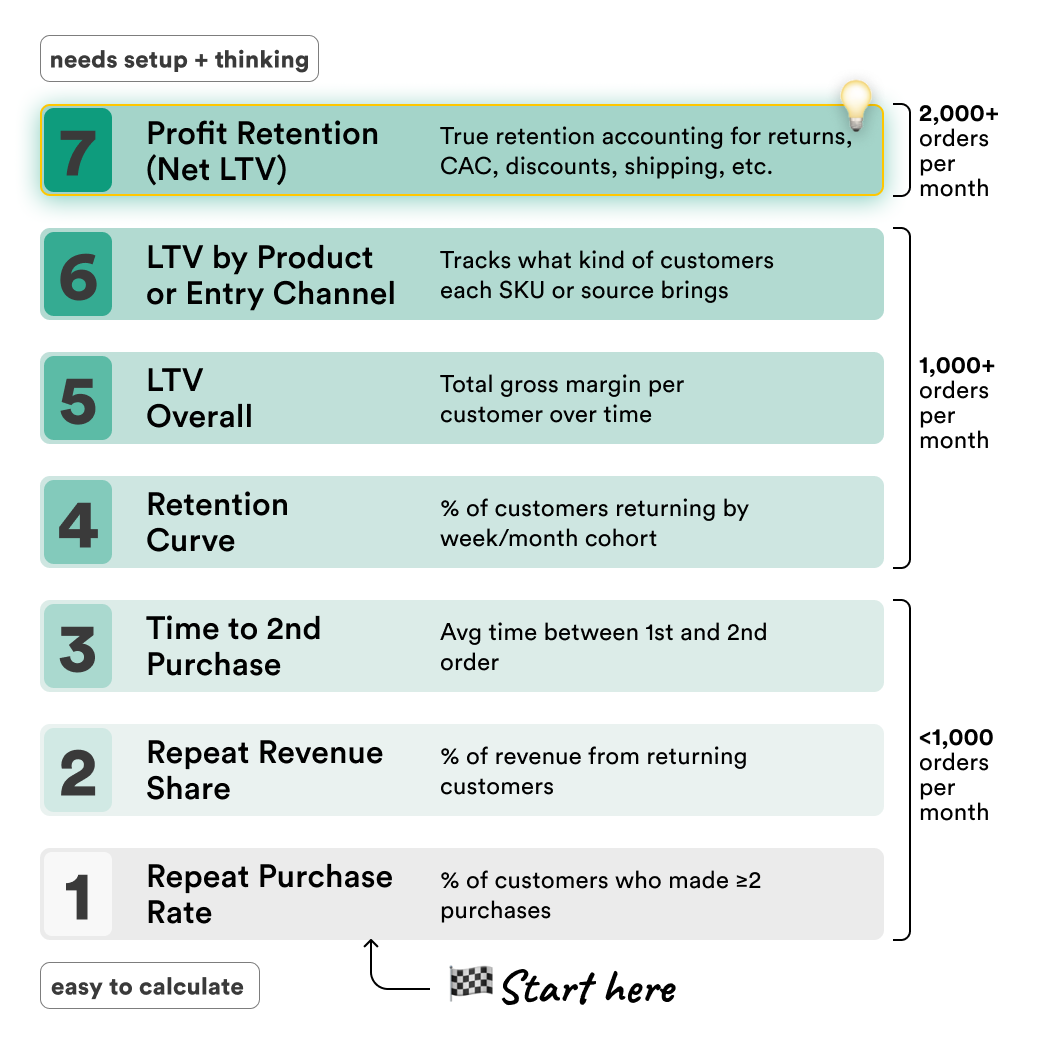
Repeat Revenue Share
This metric shows what share of your total revenue comes from returning customers — not just whether they came back.
Formula: Repeat Revenue Share = Revenue from Repeat Customers / Total RevenueTwo stores can both have a 25% Repeat Purchase Rate, but in one case those customers generate 60% of revenue, in the other just 20%. This metric shows how much of your growth actually depends on retention.
Action points:
If the share is dropping over time → run win-back emails, fix churn drivers.
If the share is stable or growing → amplify with bundles, memberships, referrals.
If most repeat revenue comes from promos → test full-price loyalty incentives.
⚠️ But revenue share still doesn’t tell you how quickly customers come back. For that, you need Time to 2nd Purchase.
Time to 2nd Purchase
This metric measures the average time gap between the first and second order.
Formula: Time to 2nd Purchase = Sum of (Date of 2nd Order − Date of 1st Order) / Number of Customers with 2+ OrdersA short gap means customers are quickly building a habit, while a long gap shows weak early retention. Watching this metric over time gives early warning signs — if the gap is getting longer, churn is coming before you see it in revenue.
Action points:
If the gap is getting longer vs previous months → fix post-purchase communication, test reorder reminders.
If most 2nd orders happen only after heavy promos → add incentives for organic early repeats (bundles, complementary product discounts).
If the gap is shrinking naturally → build momentum with upsells, cross-sells, or subscriptions.
⚠️ Knowing the speed is useful, but it still doesn’t show where exactly customers drop off. That’s where the Retention Curve comes in.
Retention Curve
The retention curve shows what % of customers return over time, usually measured by cohorts. It’s the best way to see how quickly customers are churning after their first purchase.
Formula: Retention Rate (t) = Active Customers in period t / Customers in cohort at startUnlike a single RPR number, a retention curve lets you spot when customers drop off — after 30 days, 60 days, 90 days, and so on. Comparing curves across cohorts shows whether retention is improving or getting worse for newer customers.
Action points:
If most customers disappear right after the 1st order → fix onboarding and trigger an early repeat.
If the curve levels off with too few customers left → add loyalty or long-term engagement mechanics.
If newer cohorts fall off faster than older ones → check acquisition channels or product mix.
⚠️ The retention curve shows when customers drop off, but not the overall outcome. To see the full long-term effect of retention, you need to look at Lifetime Value (LTV Overall).
LTV Overall
Lifetime Value shows how much revenue an average customer generates over their entire relationship with your store.
Formula: LTV = Total Revenue from Customers / Total CustomersUnlike RPR or repeat share, LTV captures the long-term outcome of retention. It shows whether all your retention efforts are actually paying off in customer value.
Action points:
If LTV is flat or going down → check if repeats come mostly from promos or discounts, not real demand.
If LTV is growing → keep fueling it with upsells, cross-sells, and loyalty programs.
⚠️ But looking at LTV in total can hide big differences. That’s why you need to break it down by Product and Channel.
LTV by Product / Channel
This view shows which entry products and acquisition channels bring the most valuable customers — and which ones don’t.
Formula: LTV (segment) = Total Revenue from Segment / Number of Customers in SegmentSome products or campaigns attract loyal, high-value buyers, while others only bring one-time shoppers. Without this breakdown, you can’t tell which parts of your business are actually driving sustainable growth.
Action points:
If some products show low LTV → don’t push them as entry offers, use other products to attract new buyers.
If some channels bring higher LTV → invest more there, even if CAC is higher — long-term payback is better.
⚠️ But even LTV by product or channel doesn’t show the full picture. Revenue alone can be misleading — you also need to check whether retention is profitable.
Profit Retention (Net LTV)
Net LTV adjusts customer value for all the hidden costs: discounts, returns, CAC, and logistics.
Formula: Net LTV = (Total Revenue from Customers − (Discounts + Returns + CAC + Logistics Costs)) / Total CustomersRetention can look good on paper but still destroy profit if it depends too heavily on promos or expensive acquisition. Net LTV is the “true” retention metric that shows whether repeat customers actually grow your bottom line.
Action points:
If Net LTV is much lower than Gross LTV → retention relies too much on promos or high CAC, cut back on discounts and review acquisition costs.
If Net LTV is healthy and growing → retention is profitable, safe to scale campaigns and loyalty programs.
Final thoughts
Brands polish their acquisition funnels down to the decimal.
But ask them about retention, and all they’ve got is Repeat Purchase Rate.
That’s a missed opportunity: if you’re able to bring customers back, retention will multiply your growth far more efficiently than acquisition ever could.
At the end of the day — why fight for traffic if you let it leak away?
LinkedIn post of the week
Happy analyzing 🫶
See you next week!
Dmitry from JetMetrics